Changing colours and legends in lattice plots
lattice
,
legend
,
par.settings
,
R
,
settings
,
Tutorials
No comments
Eventually I would like to get the following result:

I start with a simple bar chart, using the
Insurance data set of the MASS package.Please note that if you use R-2.15.2 or higher you may get a warning message with the current version of lattice (0.20-10), but this is a known issue, and I don't think you need to worry about it.
library(MASS)
library(lattice)
## Plot the claims frequency against age group by engine size and district
barchart(Claims/Holders ~ Age | Group, groups=District,
         data=Insurance, origin=0, auto.key=TRUE)
To change the legend I specify a list with the various options for
auto.key. Here I want to set the legend items next to each other, add a title for the legend and change its font size: barchart(Claims/Holders ~ Age | Group, groups=District,
data=Insurance, main="Claims frequency",
auto.key=list(space="top", columns=4,
title="District", cex.title=1))
Eventually I want to use my own panel function, but when I do that the legend will show points by default. So, how do I change this? In the next step I create a line plot and specify the legend to display lines instead of the default points:
xyplot(Claims/Holders ~ Age | Group, groups=District,
       data=Insurance, t="l", main="Claims frequency",
       auto.key=list(space="top", columns=4,
                     title="District", cex.title=1,
                     lines=TRUE, points=FALSE))
Now I would like to change the colours. It is much easier to change the colour settings of lattice plots by changing the default parameters rather than fiddling with the colour parameters in the lattice functions itself. This approach also ensures that the legend colours will align automatically with the plot colours. So lets display the default lattice settings:
show.settings()

Let's change the colours to one of the RColorBrewer palettes.
library(RColorBrewer)
display.brewer.all()
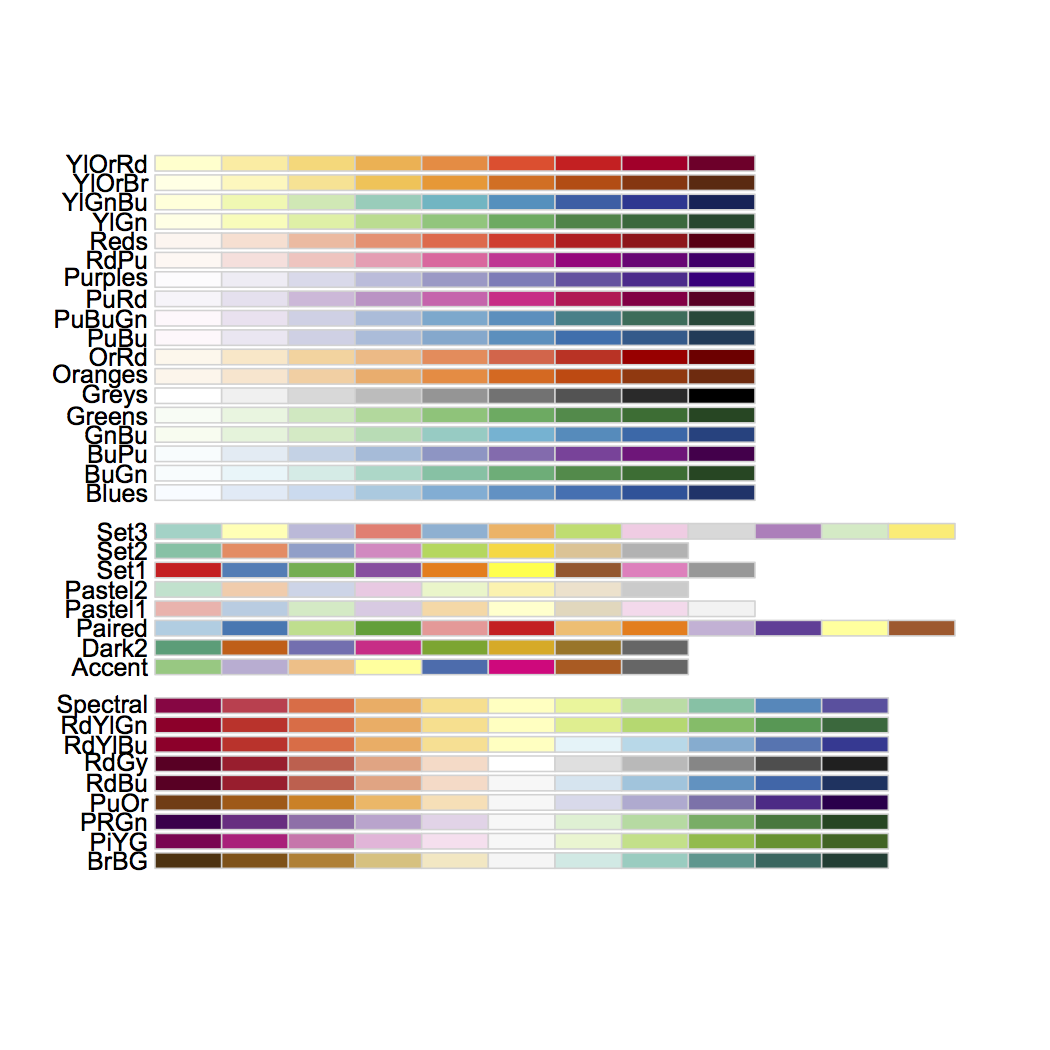
I like the Blues, so for my bar chart I'd like to change the superpose polygon (as I am using groups), the strip border and background:
myColours <- brewer.pal(6,"Blues")

my.settings <- list(
  superpose.polygon=list(col=myColours[2:5], border="transparent"),
  strip.background=list(col=myColours[6]),
  strip.border=list(col="black")
)
trellis.par.get(). I can change the default settings via trellis.par.set(my.settings) globally, but I rather use the par.settings argument in the lattice function to change it locally.Now I bring it all together, change the colour settings and legend in the following statement. As I define my own panel function, I have to set the legend to rectangles explicitly, in a similar way as above for the line plot.
barchart(Claims/Holders*100 ~ Age | Group, groups=District,
         data=Insurance, origin=0,
         main="Motor insurance claims frequency",
         xlab="Age", ylab="Claims frequency %",
         scales=list(alternating=1),
         auto.key=list(space="top", columns=4,
                       points=FALSE, rectangles=TRUE,
                       title="District", cex.title=1),
         par.settings = my.settings,
         par.strip.text=list(col="white", font=2),
         panel=function(x,y,...){
               panel.grid(h=-1, v=0);
               panel.barchart(x,y,...)
               }
)If you happen to be in London tonight, come along to the LondonR meeting, Rich Pugh runs an Introduction to Lattice from 5 - 6pm.
Session Info
sessionInfo()
R Under development (unstable) (2012-10-19 r60974)
Platform: x86_64-apple-darwin9.8.0/x86_64 (64-bit)

locale:
[1] en_GB.UTF-8/en_GB.UTF-8/en_GB.UTF-8/C/en_GB.UTF-8/en_GB.UTF-8

attached base packages:
[1] stats     graphics  grDevices utils     datasets  methods   base

other attached packages:
[1] RColorBrewer_1.0-5 lattice_0.20-10    MASS_7.3-22

loaded via a namespace (and not attached):
[1] grid_2.16.0  tools_2.16.0
References
[1] Sarkar, Deepayan (2008) Lattice: Multivariate Data Visualization with R. Springer, New York. ISBN 978-0-387-75968-5


No comments :
Post a Comment