Interactive presentations with deck.js
Data analysis is often an iterative and interactive process. However, when I present about this subject, I feel often limited by the presentation software I use. It doesn't matter if I use LaTeX/PDF, PowerPoint or Keynote. In all cases it is either very difficult or impossible to include interactive charts, such as Flash or SVG charts. As a result I have to switch between various applications during the talk. This can be fun, but quite often it is not.
The other day I came across a presentation by Christopher Gandrud. Christopher had used deck.js, a JavaScript library for building HTML presentations by Caleb Troughton.
This looked like an interesting approach to me and fortunately the learning curve was not too steep, although I am by no means an html or JavaScript expert. So I created my first deck.js presentation based on the content of previous googleVis presentations. For the first time I can embed videos, Flash and SVG charts without using lots of different apps. I am actually quite pleased by the result, see here: Getting started with googleVis

Now imagine a presentation hosted on a server with R installed! You could combine your slides with R using one of the following packages R.rsp, brew, Rook, etc and run live demos, without opening a console.
The other day I came across a presentation by Christopher Gandrud. Christopher had used deck.js, a JavaScript library for building HTML presentations by Caleb Troughton.
This looked like an interesting approach to me and fortunately the learning curve was not too steep, although I am by no means an html or JavaScript expert. So I created my first deck.js presentation based on the content of previous googleVis presentations. For the first time I can embed videos, Flash and SVG charts without using lots of different apps. I am actually quite pleased by the result, see here: Getting started with googleVis
deck.js
,
googleVis
,
interactive
,
Presentations
,
R
,
Tutorials
Stochastic reserving with R: ChainLadder 0.1.5-1 released
Today we published version 0.1.5-1 of the
The package started out of presentations given at the Stochastic Reserving Seminar at the Institute of Actuaries in 2007, 2008 and 2010, followed by talks at CAS meetings in 2008 and 2010.
Initially the package came with implementations of the Mack-, Munich- and Bootstrap Chain-Ladder methods. Since version 0.1.3-3 it also provides general multivariate chain ladder models by Wayne Zhang. Version 0.1.4-0 introduced new functions on loss development factor fitting and Cape Cod by Daniel Murphy following a paper by David Clark. Version 0.1.5-0 has added loss reserving models within the generalized linear model framework following a paper by England P. and Verrall R. (1999) implemented by Wayne Zhang.
For more details see the project web site: http://code.google.com/p/chainladder/ and an early blog entry about R in the insurance industry.
Changes in version 0.1.5-1:
ChainLadder package for R. It provides methods which are typically used in insurance claims reserving to forecast future claims payments. |
| Claims development and chain-ladder forecast of the RAA data set using the Mack method |
Initially the package came with implementations of the Mack-, Munich- and Bootstrap Chain-Ladder methods. Since version 0.1.3-3 it also provides general multivariate chain ladder models by Wayne Zhang. Version 0.1.4-0 introduced new functions on loss development factor fitting and Cape Cod by Daniel Murphy following a paper by David Clark. Version 0.1.5-0 has added loss reserving models within the generalized linear model framework following a paper by England P. and Verrall R. (1999) implemented by Wayne Zhang.
For more details see the project web site: http://code.google.com/p/chainladder/ and an early blog entry about R in the insurance industry.
Changes in version 0.1.5-1:
- Internal changes to
plot.MackChainLadderto pass new checks introduced by R 2.14.0.
- Commented out unnecessary creation of 'io' matrix in
ClarkCapeCodfunction. Allows for analysis of very large matrices forCapeCodwithout running out of RAM. 'io' matrix is an integral part ofClarkLDF, and so remains in that function.
-
plot.clarkmethod
- Removed "conclusion" stated in
QQplotof clark methods.
- Restore 'par' settings upon exit
- Slight change to the title
- Removed "conclusion" stated in
- Reduced the minimum 'theta' boundary for weibull growth function
- Added warnings to
as.triangleif origin or dev. period are not numeric
Here is a little example using the googleVis package to display the RAA claims development triangle:
library(ChainLadder)
library(googleVis)
data(RAA) # example data set of the ChainLadder package
class(RAA) <- "matrix" # change the class from triangle to matrix
df <- as.data.frame(t(RAA)) # coerce triangle into a data.frame
names(df) <- 1981 : 1990
df$dev <-  1:10
plot(gvisLineChart(df, "dev", options=list(gvis.editor="Edit me!", hAxis.title="dev. period")))
ChainLadder
,
Insurance
,
R
,
reserving
,
Soapbox
Installing R 2.14.0 on an iBook G4 running Mac OS 10.4.11
My 12" iBook G4 is celebrating its 8th birthday today! Time for a little present. How about R 2.14.0?
 The iBook is still in daily use, mostly for browsing the web, writing e-mails and this blog; and I still use it for R as well. For a long time it run R 2.10.1, the last PowerPC binary version available on CRAN for Mac OS 10.4.11 (Tiger).
But, R 2.10.1 is a bit dated by now and for the development of my googleVis package I require at least R 2.11.0. So I decided to try installing the most recent version from source, using Xcode 2.5 and TeXLive-2008.
R 2.14.0 is expected to be released on Monday (31st October 2011). The pre-release version is already available on CRAN. I assume that the pre-release version is pretty close to the final version of R 2.14.0, so why wait?
It was actually surprisingly easy to compile the command line version of R from sources. The GUI would be a nice to have, but I am perfectly happy to run R via the Terminal, xterm and Emacs. However, it shouldn't be a surprise that running
 Below you will find the building details. Please feel free to get in touch with me, if you would like access to my Apple Disk Image (dmg) file. You find my e-mail address in the maintainer field of the
Before you start, make sure you have all the Apple Developer Tools installed. I have Xcode installed in
From the pre-release directory on CRAN I downloaded the file R-rc_2011-10-28_r57465.tar.gz.
After I downloaded the file I extracted the archive and run the configure scripts to build the various Makefiles. To do this, I opened the Terminal programme (it's in the Utilities folder of Applications), changed into the directory in which I stored the tar.gz-file and typed:
The installation of additional packages worked straightforward via

But, R 2.10.1 is a bit dated by now and for the development of my googleVis package I require at least R 2.11.0. So I decided to try installing the most recent version from source, using Xcode 2.5 and TeXLive-2008.
R 2.14.0 is expected to be released on Monday (31st October 2011). The pre-release version is already available on CRAN. I assume that the pre-release version is pretty close to the final version of R 2.14.0, so why wait?
It was actually surprisingly easy to compile the command line version of R from sources. The GUI would be a nice to have, but I am perfectly happy to run R via the Terminal, xterm and Emacs. However, it shouldn't be a surprise that running
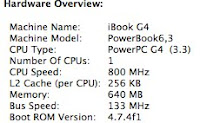
configure, make, make install on a 800 Mhz G4 with 640MB memory does take its time. googleVis package.Building R from source on Mac OS 10.4 with Xcode 2.5 (gcc-4.0.1)
Before you start, make sure you have all the Apple Developer Tools installed. I have Xcode installed in
/Developer/Applications.From the pre-release directory on CRAN I downloaded the file R-rc_2011-10-28_r57465.tar.gz.
After I downloaded the file I extracted the archive and run the configure scripts to build the various Makefiles. To do this, I opened the Terminal programme (it's in the Utilities folder of Applications), changed into the directory in which I stored the tar.gz-file and typed:
tar xvfz R-rc_2011-10-28_r57465.tar.gz
cd R-rc
./configure
This process took a little while (about 15 minutes) and at the end I received the following statement:
R is now configured for powerpc-apple-darwin8.11.0

  Source directory:          .
  Installation directory:    /Library/Frameworks

  C compiler:                gcc -std=gnu99  -g -O2
  Fortran 77 compiler:       gfortran  -g -O2

  C++ compiler:              g++  -g -O2
  Fortran 90/95 compiler:    gfortran -g -O2
  Obj-C compiler:            gcc -g -O2 -fobjc-exceptions

  Interfaces supported:      X11, aqua, tcltk
  External libraries:        readline, ICU
  Additional capabilities:   NLS
  Options enabled:           framework, shared BLAS, R profiling, Java

  Recommended packages:      yes
With all the relevant Makefiles in place I could start the build process via:
make -j8Now I had time for a cup of tea, as the build took about one hour. Finally, to finish the installation, I placed the new R version into its place in
/Library/Frameworks/ by typing:sudo make installJob done. Let's test it:
Grappa:~ Markus$ R

R version 2.14.0 RC (2011-10-28 r57465)
Copyright (C) 2011 The R Foundation for Statistical Computing
ISBN 3-900051-07-0
Platform: powerpc-apple-darwin8.11.0 (32-bit)

R is free software and comes with ABSOLUTELY NO WARRANTY.
You are welcome to redistribute it under certain conditions.
Type 'license()' or 'licence()' for distribution details.

  Natural language support but running in an English locale

R is a collaborative project with many contributors.
Type 'contributors()' for more information and
'citation()' on how to cite R or R packages in publications.

Type 'demo()' for some demos, 'help()' for on-line help, or
'help.start()' for an HTML browser interface to help.
Type 'q()' to quit R.

> for(i in 1:8) print("Happy birthday iBook!")
[1] "Happy birthday iBook!"
[1] "Happy birthday iBook!"
[1] "Happy birthday iBook!"
[1] "Happy birthday iBook!"
[1] "Happy birthday iBook!"
[1] "Happy birthday iBook!"
[1] "Happy birthday iBook!"
[1] "Happy birthday iBook!"
The installation of additional packages worked straightforward via
install.packages(c("vector of packages")), though it took time, as everything was build from sources. This it what it looks like on my iBook G4 today:> installed.packages()[,"Version"]
ChainLadder GillespieSSA Hmisc ISOcodes KernSmooth MASS
"0.1.5-0" "0.5-4" "3.8-3" "2011.07.31" "2.23-6" "7.3-16"
Matrix R.methodsS3 R.oo R.rsp R.utils RColorBrewer
"1.0-1" "1.2.1" "1.8.2" "0.6.2" "1.8.5" "1.0-5"
RCurl RJSONIO RUnit Rook XML actuar
"1.6-10" "0.96-0" "0.4.26" "1.0-2" "3.4-3" "1.1-2"
base bitops boot brew car class
"2.14.0" "1.0-4.1" "1.3-3" "1.0-6" "2.0-11" "7.3-3"
cluster coda codetools coin colorspace compiler
"1.14.1" "0.14-4" "0.2-8" "1.0-20" "1.1-0" "2.14.0"
data.table datasets digest flexclust foreign gam
"1.7.1" "2.14.0" "0.5.1" "1.3-2" "0.8-46" "1.04.1"
ggplot2 googleVis grDevices graphics grid iterators
"0.8.9" "0.2.10" "2.14.0" "2.14.0" "2.14.0" "1.0.5"
itertools lattice lmtest mclust methods mgcv
"0.1-1" "0.20-0" "0.9-29" "3.4.10" "2.14.0" "1.7-9"
modeltools mvtnorm nlme nnet parallel party
"0.2-18" "0.9-9991" "3.1-102" "7.3-1" "2.14.0" "0.9-99994"
plyr proto pscl reshape rpart sandwich
"1.6" "0.3-9.2" "1.04.1" "0.8.4" "3.1-50" "2.2-8"
spatial splines statmod stats stats4 strucchange
"7.3-3" "2.14.0" "1.4.13" "2.14.0" "2.14.0" "1.4-6"
survival systemfit tcltk tools utils vcd
"2.36-10" "1.1-8" "2.14.0" "2.14.0" "2.14.0" "1.2-12"
zoo
"1.7-5"
Update (3 June 2012)
Just updated my R installation to R-2.15.0 and the above procedure still worked. But I had to be patient. It took at least an hour to compile R and the core packages.R version 2.15.0 Patched (2012-06-03 r59505) -- "Easter Beagle" Copyright (C) 2012 The R Foundation for Statistical Computing ISBN 3-900051-07-0 Platform: powerpc-apple-darwin8.11.0 (32-bit)
Update (1 June 2013)
Just updated my R installation to R-3.0.1 and the above procedure still worked. The iBook will be 10 years old soon and is still going strong. Not bad for such an old laptop.R version 3.0.1 (2013-05-16) -- "Good Sport" Copyright (C) 2013 The R Foundation for Statistical Computing Platform: powerpc-apple-darwin8.11.0 (32-bit)
Using Sweave with XeLaTeX
Using R with LaTeX via Sweave is a great way to create reproducible output. However, using specific fonts, e.g. your corporate fonts, can be painful with
With XeLaTeX I had to overcome some hurdles, which I would like to share here:
The Sweave file of the above document is attached to the PDF-file itself, but you can also find it on github: SweaveXeLaTeXExample.Rnw.
pdflatex. Over the last few weeks I have fallen in love with the TeX format XeLaTeX and its XeTeX engine.With XeLaTeX I had to overcome some hurdles, which I would like to share here:
- attaching files,
- trimming and clipping images,
- learning how to use the tikzDevice package.
The Sweave file of the above document is attached to the PDF-file itself, but you can also find it on github: SweaveXeLaTeXExample.Rnw.
adjustbox
,
attachfile2
,
R
,
Sweave
,
tikz
,
tikzDevice
,
Tutorials
,
XeLaTeX
R related books: Traditional vs online publishing
How many R related books have been published so far? Who is the most popular publisher? How many other manuals, tutorials and books have been published online? Let's find out.
A few years ago I used the publication list on r-project.org as an argument with the IT department that R is an established statistical programming language and that they should allow me to install it on my PC. I believe at the time there were about 20 R related books available.
A recent post on Recology pointed me to a talk given by Ed Goodwin at the Houston R user group meeting about regular expressions in R, something I always wanted to learn properly, but never got around to do.
So let's see, if we can manage to extract the information of published R books and texts from r-project.org, with what we learned from Ed about regular expressions in R.
A few years ago I used the publication list on r-project.org as an argument with the IT department that R is an established statistical programming language and that they should allow me to install it on my PC. I believe at the time there were about 20 R related books available.
A recent post on Recology pointed me to a talk given by Ed Goodwin at the Houston R user group meeting about regular expressions in R, something I always wanted to learn properly, but never got around to do.
So let's see, if we can manage to extract the information of published R books and texts from r-project.org, with what we learned from Ed about regular expressions in R.
books
,
googleVis
,
publishers
,
R
,
regular expressions
,
Soapbox
,
XML
Setting the initial view of a motion chart in R
Following on from my article about accessing and plotting World Bank data with R I want to talk about how to change the initial view of a motion chart.
Over the last couple of weeks I have been asked a view times how to do this. For instance Stephen O'Grady wanted to create a motion chart, which shows initially a line chart, rather than a bubble chart.
Changing the initial settings of a motion chart is actually quite easy, if you know how to. The trick is to use the
As a case study I will use the World Bank data set and try to do some homework given by Duncan Temple Lang in his course on introduction to statistical computing course. Duncan asked his students to query the World Bank data base to create a line chart, which would show the number of internet users per 1000 in Africa over time. Further, he would like to see a legend next to the chart to identify which country is which and tooltips for each curve to identify the country.
A motion chart, displayed as a line chart, would do the trick.
Okay, getting the data is easy, thanks to the WDI package, or via a direct download, and so it is to create a motion chart with bubbles. Interactively I can change the bubble chart into a line chart, I can select some countries and change the y-axis to log-scale. However, when I reload the page I am back to square one: a bubble chart. So the idea is to pass the changed chart settings on to the initial plot. I find those settings, of the current view, as a string in the advanced tab of the settings window. I click on the wrench symbol in the bottom right hand corner of a motion chart to access this window.
Next I copy this string and paste it into the
Here is an example, where I pre-selected Sierra Leone and Seychelles (countries with the lowest and highest number of internet users) together with Africa, North Africa and Sub-Saharan Africa (all income levels). You find the R code below to replicate the plot.
What does the data tell you? Play around with the graph, e.g. change it to a column graph, deselect all countries and change the y-axes to linear again, and hit the play button. How could we improve the plot?
Over the last couple of weeks I have been asked a view times how to do this. For instance Stephen O'Grady wanted to create a motion chart, which shows initially a line chart, rather than a bubble chart.
Changing the initial settings of a motion chart is actually quite easy, if you know how to. The trick is to use the
state argument in the list of options of gvisMotionChart.As a case study I will use the World Bank data set and try to do some homework given by Duncan Temple Lang in his course on introduction to statistical computing course. Duncan asked his students to query the World Bank data base to create a line chart, which would show the number of internet users per 1000 in Africa over time. Further, he would like to see a legend next to the chart to identify which country is which and tooltips for each curve to identify the country.
A motion chart, displayed as a line chart, would do the trick.
Okay, getting the data is easy, thanks to the WDI package, or via a direct download, and so it is to create a motion chart with bubbles. Interactively I can change the bubble chart into a line chart, I can select some countries and change the y-axis to log-scale. However, when I reload the page I am back to square one: a bubble chart. So the idea is to pass the changed chart settings on to the initial plot. I find those settings, of the current view, as a string in the advanced tab of the settings window. I click on the wrench symbol in the bottom right hand corner of a motion chart to access this window.
 |
| Screen shot the settings window of a motion chart |
Next I copy this string and paste it into the
state argument of the options list. Note the line break at the beginning and at the end of the state string in the example. Alternatively I can add \n to both side of the state string. Here is an example, where I pre-selected Sierra Leone and Seychelles (countries with the lowest and highest number of internet users) together with Africa, North Africa and Sub-Saharan Africa (all income levels). You find the R code below to replicate the plot.
What does the data tell you? Play around with the graph, e.g. change it to a column graph, deselect all countries and change the y-axes to linear again, and hit the play button. How could we improve the plot?
googleVis
,
initial view
,
Motion Chart
,
options
,
R
,
RJSONIO
,
Tutorials
,
WDI
,
World Bank
Accessing and plotting World Bank data with R
Over the past couple of days I played around with the data sets of the World Bank, and I have to admit that I am blown away by it. It is amazing, to see what is available on their web site and it is worth visiting their Data Visualisation Tools page. It is fantastic that they provide an API to their data. They have used it to build an iPhone App which is pretty cool. You can have the world's data in your pocket.
In this post I will show you how we can access data from the World Bank in R. As an example we create a motion chart, in the Hans Rosling style, as you find it on the Google Public Data Explorer site, which also uses data from the World Bank. Doing this, should give us the confidence that we understand the World Bank's interface. You can find this example as demo
So let's try to replicate the initial plot of the Google Public Data Explorer, which shows fertility rate against life expectancy for each country from 1960 to today, whereby the countries are represented as bubbles, with the size reflecting the population and the colour the region.
In this post I will show you how we can access data from the World Bank in R. As an example we create a motion chart, in the Hans Rosling style, as you find it on the Google Public Data Explorer site, which also uses data from the World Bank. Doing this, should give us the confidence that we understand the World Bank's interface. You can find this example as demo
WorldBank as part of the googleVis package from version 0.2.10 onwards.So let's try to replicate the initial plot of the Google Public Data Explorer, which shows fertility rate against life expectancy for each country from 1960 to today, whereby the countries are represented as bubbles, with the size reflecting the population and the colour the region.


