R in Insurance: Abstract submission closes end of March
Hurry! The abstract submission deadline for the 3rd R in Insurance conference in Amsterdam, 29 June 2015 is approaching soon.

You have until the 28th of March to submit a one-page abstract for consideration. Both academic and practitioner proposals related to R are encouraged. Please email your abstract of no more than 300 words (in text or pdf format) to r-in-insurance@uva.nl.
The intended audience of the conference includes both academics and practitioners who are active or interested in the applications of R in insurance.
Invited talks will be given by:
Special thanks to our sponsors again: Rstudio, Cybea, Applied AI, Milliman, QBE, AEGON and Delta Lloyd Amsterdam.
Btw, notes from last year's conference were published in the R Journal.

You have until the 28th of March to submit a one-page abstract for consideration. Both academic and practitioner proposals related to R are encouraged. Please email your abstract of no more than 300 words (in text or pdf format) to r-in-insurance@uva.nl.
The intended audience of the conference includes both academics and practitioners who are active or interested in the applications of R in insurance.
Invited talks will be given by:
- Prof. Richard Gill, Leiden University
- Dr James Guszcza, FCAS, Chief Data Scientist, Deloitte - US
Special thanks to our sponsors again: Rstudio, Cybea, Applied AI, Milliman, QBE, AEGON and Delta Lloyd Amsterdam.
Btw, notes from last year's conference were published in the R Journal.
Notes from the Kölner R meeting, 6 March 2015
At last Friday's Cologne R user group meeting we welcomed two Northerners from the left and right (or 'right' and 'wrong') side of the Rhine.
Günter and Michael presented examples of a new R Excel plugin 'Calidris' they developed using R.net. The plugin itself is written in C# and adds an R ribbon to Excel with pre-build functions.

In its current form the add-in is a proof of concept. It demonstrates in principal that functions based on R can be added to Excel. The version Günter and Michael demonstrated doesn't have a reactive functionality yet, i.e. updating a cell will not update the output of an R function automatically at the moment. Feel free to get in touch with them if you would like to know more about their project. You find their contact details on the last slide of their presentation.
Cornelius gave an engaging high-level overview on text mining with R, covering:
A nice and illustrative example Cornelius presented at the end of his talk was the package
Using R in Excel via R.NET
Günter Faes and Matthias Spix |
| Download slides |
Günter and Michael presented examples of a new R Excel plugin 'Calidris' they developed using R.net. The plugin itself is written in C# and adds an R ribbon to Excel with pre-build functions.

In its current form the add-in is a proof of concept. It demonstrates in principal that functions based on R can be added to Excel. The version Günter and Michael demonstrated doesn't have a reactive functionality yet, i.e. updating a cell will not update the output of an R function automatically at the moment. Feel free to get in touch with them if you would like to know more about their project. You find their contact details on the last slide of their presentation.
Text Mining with R
Cornelius Puschmann |
| Download slides |
Cornelius gave an engaging high-level overview on text mining with R, covering:
- From natural language processing (NLP) to text mining
- Building corpora
- Latent semantic analysis (LSA)
- Topic models/Latent Dirichlet allocation (LDA)
- Sentiment analysis
- Misc useful packages
A nice and illustrative example Cornelius presented at the end of his talk was the package
gender by Linclon Mullen that uses historical US census data to predict the gender of people based on their first name. I have several colleagues with the name of 'Leslie' or 'Lesley'. Thanks to gender I know now that my male colleagues are more likely to be spelled 'Leslie' than 'Lesley' and that a person with either name is more likely to be female.library(gender)
L1 <- gender("Leslie")
L2 <- gender("Lesley")
cbind(L1, L2)
L1 L2
name "Leslie" "Lesley"
proportion_male 0.2222 0.0995
proportion_female 0.7778 0.9005
gender "female" "female"
year_min 1932 1932
year_max 2012 2012
Drinks and Networking
No Cologne R user group meeting would be complete without drinks and schnitzel at the Lux. |
| Photo: Günter Faes |
Next Kölner R meeting
The next meeting will be Friday, 26 June. Note the new larger venue: Startplatz, Im Mediapark 5, Köln. We will have two talks:- Data Science at the Commandline (Kirill Pomogajko)
- An Introduction to RStan and the Stan Modelling Language (Paul Viefers)
Excel
,
Koelner R User
,
Kölner R Users
,
R
,
R.net
,
text mining
Next Kölner R User Meeting: Friday, 6 March 2015

The next Cologne R user group meeting is scheduled for this Friday, 6 March 2015 and we have an exciting agenda with two talks, followed by networking drinks:
Using R in Excel via R.NET
Günter Faes and Matthias SpixMS Office and Excel are the 'de-facto' standards in many industries. Using R with Excel offers an opportunity to combine the statistical power of R with a familiar user interface. R.net offers a user friendly interfaces to Excel; R functions work just like Excel functions and are basically hidden away.
Text Mining with R
Cornelius PuschmannIn addition to the analysis of numerical data, R is increasingly attractive for processing text as well. Cornelius will give a very brief overview of common text mining techniques and their corresponding R implementations, with a focus on useful applications in the social sciences. Techniques will include corpus creation and management (package tm), latent semantic analysis (package lsa), and topic models (package topicmodels), as well as sentiment analysis (experimental package syuzhet). Simple but useful routines such as automatically inferring the language of a text (package text cat , or the gender of a first name (package genderize) will also be briefly pointed out.
Drinks and Networking
The event will be followed by drinks and schnitzel at the Lux.For further details visit our KölnRUG Meetup site. Please sign up if you would like to come along. Notes from past meetings are available here.
The organisers, Bernd Weiß and Markus Gesmann, gratefully acknowledge the sponsorship of Revolution Analytics, who support the Cologne R user group as part of their Matrix programme.
View Larger Map
Minimal examples help
The other day I got stuck working with a huge data set using
Ok, here is the problem. Well, easy to write down now, after I understood it.
Suppose, I have some data that describes my sales targets by product and quarter:
Further, I have some actual data, which is also broken down by region, but has no data for coconut:
What I would like to do is to join both data sets together, so that I can compare my sales figures with my targets. In particular, I would like to see also my targets for future quarters. However, I would like to filter out the target data for those products that are not available in a region, coconut in my example.
First I have to set keys for my data sets on which I would like to join them:
Because I want to see also future targets I am not using
Ok, that means I have to filter for the products in my actual data to match the relevant planning data:
That's it. Now I can get back to my original huge and complex data set and move on.
Please let me know if there is a better way of achieving the above.
data.table in R. It took me a little while to realise that I had to produce a minimal reproducible example to actually understand why I got stuck in the first place. I know, this is the mantra I should follow before I reach out to R-help, Stack Overflow or indeed the package authors. Of course, more often than not, by following this advise, the problem becomes clear and with that the solution obvious. Ok, here is the problem. Well, easy to write down now, after I understood it.
Suppose, I have some data that describes my sales targets by product and quarter:
library(data.table)
Plan <- data.table(
  Product=c(rep("Apple",3),rep("Kiwi",3),rep("Coconut",3)),
  Quarter=rep(c(1,2,3), 3),
  Target=1:9)
Plan
##    Product Quarter Target
## 1:   Apple       1      1
## 2:   Apple       2      2
## 3:   Apple       3      3
## 4:    Kiwi       1      4
## 5:    Kiwi       2      5
## 6:    Kiwi       3      6
## 7: Coconut       1      7
## 8: Coconut       2      8
## 9: Coconut       3      9
Further, I have some actual data, which is also broken down by region, but has no data for coconut:
Actual <- data.table(
 Region=rep(c("North", "South"), each=4),
 Product=rep(c("Apple", "Kiwi"), times=4),
 Quarter=rep(c(1,1,2,2), 2), Sales=1:8)
Actual
##    Region Product Quarter Sales
## 1:  North   Apple       1     1
## 2:  North    Kiwi       1     2
## 3:  North   Apple       2     3
## 4:  North    Kiwi       2     4
## 5:  South   Apple       1     5
## 6:  South    Kiwi       1     6
## 7:  South   Apple       2     7
## 8:  South    Kiwi       2     8
What I would like to do is to join both data sets together, so that I can compare my sales figures with my targets. In particular, I would like to see also my targets for future quarters. However, I would like to filter out the target data for those products that are not available in a region, coconut in my example.
First I have to set keys for my data sets on which I would like to join them:
setkey(Actual, Product, Quarter)
setkey(Plan, Product, Quarter)
Because I want to see also future targets I am not using
Plan[Actual]. Instead I join the Plan data for each region; but then I get also the target data for coconut:Actual[, .SD[Plan], by=list(Region)]
## Region Product Quarter Sales Target
## 1: North Apple 1 1 1
## 2: North Apple 2 3 2
## 3: North Apple 3 NA 3
## 4: North Coconut 1 NA 7
## 5: North Coconut 2 NA 8
## 6: North Coconut 3 NA 9
## 7: North Kiwi 1 2 4
## 8: North Kiwi 2 4 5
## 9: North Kiwi 3 NA 6
## 10: South Apple 1 5 1
## 11: South Apple 2 7 2
## 12: South Apple 3 NA 3
## 13: South Coconut 1 NA 7
## 14: South Coconut 2 NA 8
## 15: South Coconut 3 NA 9
## 16: South Kiwi 1 6 4
## 17: South Kiwi 2 8 5
## 18: South Kiwi 3 NA 6
Ok, that means I have to filter for the products in my actual data to match the relevant planning data:
Actual[, .SD[
  Plan[
    Product %in% unique(.SD[, Product])
    ]
  ], by=list(Region)]
##     Region Product Quarter Sales Target
##  1:  North   Apple       1     1      1
##  2:  North   Apple       2     3      2
##  3:  North   Apple       3    NA      3
##  4:  North    Kiwi       1     2      4
##  5:  North    Kiwi       2     4      5
##  6:  North    Kiwi       3    NA      6
##  7:  South   Apple       1     5      1
##  8:  South   Apple       2     7      2
##  9:  South   Apple       3    NA      3
## 10:  South    Kiwi       1     6      4
## 11:  South    Kiwi       2     8      5
## 12:  South    Kiwi       3    NA      6
That's it. Now I can get back to my original huge and complex data set and move on.
Please let me know if there is a better way of achieving the above.
Session Info
R version 3.1.2 Patched (2015-01-20 r67564)
Platform: x86_64-apple-darwin13.4.0 (64-bit)
Running under: OS X 10.10.2 (Yosemite)

locale:
[1] en_GB.UTF-8/en_GB.UTF-8/en_GB.UTF-8/C/en_GB.UTF-8/en_GB.UTF-8

attached base packages:
[1] stats graphics grDevices utils datasets methods base

other attached packages:
[1] data.table_1.9.4

loaded via a namespace (and not attached):
[1] chron_2.3-45 plyr_1.8.1 Rcpp_0.11.4 reshape2_1.4.1 stringr_0.6.2
data.table
,
join
,
R
Reading Arduino data directly into R
I have experimented with reading an Arduino signal into R in the past, using Rserve and Processing. Actually, it is much easier. I can read the output of my Arduino directly into R with the
Here is my temperature sensor example again:

And all it needs to read the signal into the R console with my computer is:
Note: This worked for me on my Mac and I am sure it will work in a very similar way on a Linux box as well, but I am not so sure about Windows. Crucially, I had to learn the difference between the tty* and cu* devices. I found the following statement in Mike's PBX Cookbook particular insightful:
With a little more R code I can create a 'live' data stream plot of my Arduino.
R code
Here is the original Arduino sketch as well:
scan function. Here is my temperature sensor example again:

And all it needs to read the signal into the R console with my computer is:
> f <- file("/dev/cu.usbmodem3a21", open="r")
> scan(f, n=1)
Read 1 item
[1] 20.8
> close(f)Note: This worked for me on my Mac and I am sure it will work in a very similar way on a Linux box as well, but I am not so sure about Windows. Crucially, I had to learn the difference between the tty* and cu* devices. I found the following statement in Mike's PBX Cookbook particular insightful:
You might notice that each serial device shows up twice in /dev, once as a tty.* and once as a cu.*. So, what's the difference? Well, TTY devices are for calling into UNIX systems, whereas CU (Call-Up) devices are for calling out from them (eg, modems). We want to call-out from our Mac, so /dev/cu.* is the correct device to use.You find the file address of your Arduino by opening the Arduino software and looking it up under the menu Tools > Port.
With a little more R code I can create a 'live' data stream plot of my Arduino.
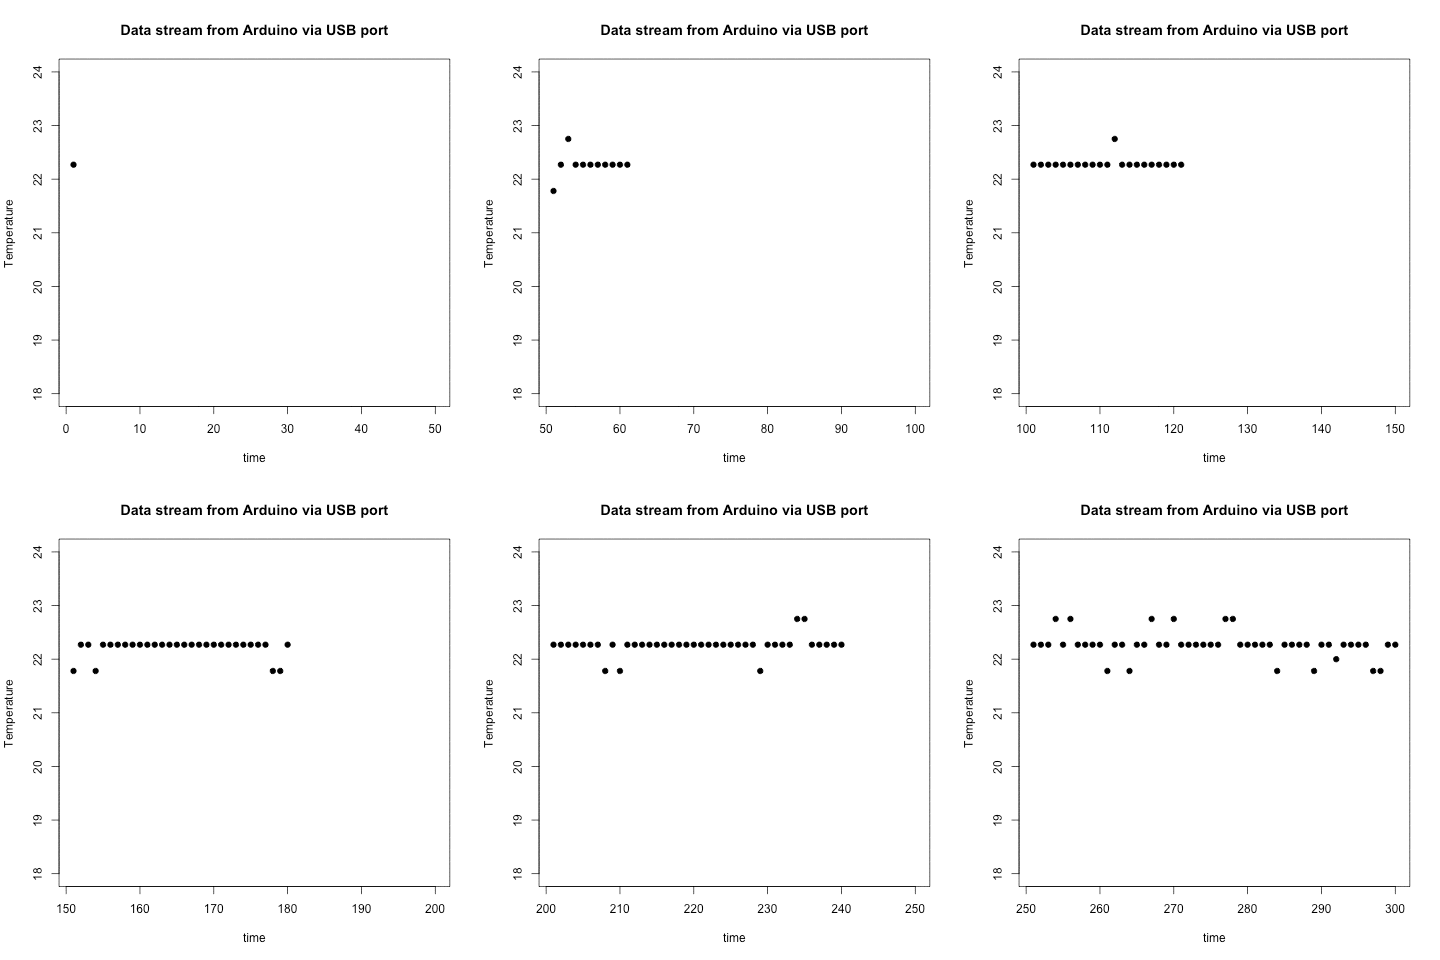 |
| Reload this page to see the animated Gif again. |
R code
Here is the original Arduino sketch as well:
Session Info
R version 3.1.2 (2014-10-31)
Platform: x86_64-apple-darwin13.4.0 (64-bit)

locale:
[1] en_GB.UTF-8/en_GB.UTF-8/en_GB.UTF-8/C/en_GB.UTF-8/en_GB.UTF-8

attached base packages:
[1] stats graphics grDevices utils datasets  methods
[7] base

loaded via a namespace (and not attached):
[1] tools_3.1.
Arduino
,
R
,
read serial
,
scan
What have a physicist, an entrepreneur and an actor in common?
They all try to do something new and take the risk to be seen as a fool.
Over the last few days I stumbled over three videos by a physicist, an entrepreneur and an actor, which at first have little in common, but they do. They all need to know when they are wrong in order to progress. If you are not wrong, then you are likely to be right, but that is often difficult to prove - often not at all.
Here I have Richard Feynman, Rob Fitzpatrick and Michael Caine.
Start with a guess for a new law. Predict the consequences and compare the prediction with the results of experiments. If the experiments disagree with your prediction, then your idea is wrong.
Ask your mum questions about the assumptions of your new business idea, without telling her anything about it. Do this in the same way with friends, without them knowing that you talk about a new business idea. This will require a great care in the way you phrase your questions. Don't fish for compliments. If the answers are different from your exceptions, then your assumptions are wrong and perhaps your business idea as well.
Rehearse your dialogue and observe how other people react to it. If they say something like "I am sorry, I see you are rehearsing, but I need to talk to you", then you are not doing it well. If on the other hand they join the conversation, so that you have to say: "I am sorry, but we are rehearsing" then you are getting there.
Willing/wanting to know when you are wrong is one the hardest things to accept, and yet the best way to progress quickly.
Over the last few days I stumbled over three videos by a physicist, an entrepreneur and an actor, which at first have little in common, but they do. They all need to know when they are wrong in order to progress. If you are not wrong, then you are likely to be right, but that is often difficult to prove - often not at all.
- The physicist has an idea for a new law. How does he/she know if it is wrong?
- The entrepreneur has an idea for a new business. How does he/she know if it won't make money?
- The actor is rehearsing a new scene. How does he/she know if the acting is not believable?
Here I have Richard Feynman, Rob Fitzpatrick and Michael Caine.
The physicist
Start with a guess for a new law. Predict the consequences and compare the prediction with the results of experiments. If the experiments disagree with your prediction, then your idea is wrong.
The entrepreneur
Ask your mum questions about the assumptions of your new business idea, without telling her anything about it. Do this in the same way with friends, without them knowing that you talk about a new business idea. This will require a great care in the way you phrase your questions. Don't fish for compliments. If the answers are different from your exceptions, then your assumptions are wrong and perhaps your business idea as well.
The actor
Rehearse your dialogue and observe how other people react to it. If they say something like "I am sorry, I see you are rehearsing, but I need to talk to you", then you are not doing it well. If on the other hand they join the conversation, so that you have to say: "I am sorry, but we are rehearsing" then you are getting there.
Willing/wanting to know when you are wrong is one the hardest things to accept, and yet the best way to progress quickly.
acting
,
entrepreneur
,
physics
,
science
R in Insurance 2015: Registration Opened
The registration for the third conference on R in Insurance on Monday 29 June 2015 at the University of Amsterdam has opened.
This one-day conference will focus again on applications in insurance and actuarial science that use R, the lingua franca for statistical computation.
The intended audience of the conference includes both academics and practitioners who are active or interested in the applications of R in insurance.
Invited talks will be given by:
We invite you to submit a one-page abstract for consideration. Both academic and practitioner proposals related to R are encouraged. The submission deadline for abstracts is 28 March 2015.
Please email your abstract of no more than 300 words (in text or pdf format) to r-in-insurance@uva.nl.
Details about the registration and abstract submission are given on the dedicated R in Insurance page at the University of Amsterdam.
For more information about the past events visit www.rininsurance.com.
This one-day conference will focus again on applications in insurance and actuarial science that use R, the lingua franca for statistical computation.
The intended audience of the conference includes both academics and practitioners who are active or interested in the applications of R in insurance.
Invited talks will be given by:
- Prof. Richard Gill, Leiden University
- Dr James Guszcza, FCAS, Chief Data Scientist, Deloitte - US
We invite you to submit a one-page abstract for consideration. Both academic and practitioner proposals related to R are encouraged. The submission deadline for abstracts is 28 March 2015.
Please email your abstract of no more than 300 words (in text or pdf format) to r-in-insurance@uva.nl.
Details about the registration and abstract submission are given on the dedicated R in Insurance page at the University of Amsterdam.
For more information about the past events visit www.rininsurance.com.
Conference
,
Insurance
,
News
,
R
,
R in Insurance


