R in Insurance 2015 Conference Programme
The programme for the 3rd R in Insurance conference is on-line. The event will take place on 29 June 2015 at the University of Amsterdam. Time to register now.

Special thanks to our sponsors, without whom the conference wouldn't be possible:
CYBAEA, RStudio, APPLIED AI, Milliman, QBE Re, AEGON, Delta Lloyd Amsterdam , Deloitte.
You find impressions from the previous events on www.rininsurance.com.
We hope to see you in Amsterdam!
Special thanks to our sponsors, without whom the conference wouldn't be possible:
CYBAEA, RStudio, APPLIED AI, Milliman, QBE Re, AEGON, Delta Lloyd Amsterdam , Deloitte.
You find impressions from the previous events on www.rininsurance.com.
We hope to see you in Amsterdam!
Combining several lattice charts into one
Last week I mentioned the
Here is minimal example from the help file of

In my next example I am using data from Eurostat, the statistical office of the European Union, showing the use of public transport in four countries. The data can be accessed directly in R via the eurostat package; see also the package vignette.

Here I have two
grid.arrange function of the gridExtra package that allows me to combine graphical grid objects onto one page. The latticeExtra package provides another elegant solution for trellis (lattice) plots: the function c.trellis() or just c() combines the panels of multiple trellis objects into one. Here is minimal example from the help file of
c.trellis:library(latticeExtra)
## Combine different types of plots.
c(wireframe(volcano), contourplot(volcano))

In my next example I am using data from Eurostat, the statistical office of the European Union, showing the use of public transport in four countries. The data can be accessed directly in R via the eurostat package; see also the package vignette.

Here I have two
xyplot objects that I combine into one chart using a named vector. I know this is not the best way to present the data, but that is not the point here. Naming the elements in c() adds those names also into the panel strip. Very handy indeed!Session Info
R version 3.1.3 (2015-03-09)
Platform: x86_64-apple-darwin13.4.0 (64-bit)
Running under: OS X 10.10.3 (Yosemite)

locale:
[1] en_GB.UTF-8/en_GB.UTF-8/en_GB.UTF-8/C/en_GB.UTF-8/en_GB.UTF-8

attached base packages:
[1] stats     graphics  grDevices utils     datasets  methods
[7] base

other attached packages:
[1] latticeExtra_0.6-26 lattice_0.20-31     RColorBrewer_1.1-2
[4] eurostat_1.0.16

loaded via a namespace (and not attached):
[1] grid_3.1.3     plyr_1.8.1     Rcpp_0.11.5    reshape2_1.4.1
[5] stringi_0.4-1  stringr_0.6.2  tidyr_0.2.0    tools_3.1.3
c.trellis
,
eurostat
,
latticeExtra
,
R
Plotting tables alsongside charts in R
Occasionally I'd like to plot a table alongside a chart in R, e.g. to present summary statistics of the graph itself. Thanks to the
Here is a little example:

gridExtra package this is quite straightforward. The function tableGrob creates a table like plot of a data frame, while arrangeGrob allows me to arrange ggplot2, lattice and grid graphical objects (short 'grobs', such as tableGrob) on a page.Here is a little example:

Session Info
R version 3.2.1 (2015-06-18)
Platform: x86_64-apple-darwin13.4.0 (64-bit)
Running under: OS X 10.10.4 (Yosemite)

locale:
[1] en_GB.UTF-8/en_GB.UTF-8/en_GB.UTF-8/C/en_GB.UTF-8/en_GB.UTF-8

attached base packages:
[1] stats     graphics  grDevices utils     datasets  methods
[7] base

other attached packages:
[1] gridExtra_2.0.0 ggplot2_1.0.1

loaded via a namespace (and not attached):
 [1] Rcpp_0.11.6      digest_0.6.8     MASS_7.3-42
 [4] grid_3.2.1       plyr_1.8.3       gtable_0.1.2
 [7] magrittr_1.5     scales_0.2.5     stringi_0.5-5
[10] reshape2_1.4.1   proto_0.3-10     labeling_0.3
[13] tools_3.2.1      stringr_1.0.0    munsell_0.4.2
[16] colorspace_1.2-6
arrangeGrob
,
ggplot2
,
R
,
tableGrob
Test Driven Analysis
I mused over Test Driven Analysis on this blog before, but it was Richard Pugh's talk on SAS to R Migration at LondonR last week that brought the topic back into my mind and clarified a few things.
Rich's presentation focused on the challenge of how to ensure that the new system (R) would provide the same answers as the legacy system (SAS).
This is when it clicked with me: My brain is just another system as well. Suppose you have an idea for an analysis in your head. Taking that idea and transforming it into code is basically just the same as migrating code from one system to another system. Or, isn't it?
Rich showed us how he does it: Start with the old code, write unit tests in the legacy system to confirm your understanding, re-write the unit tests in the new system and then start building the new analysis code in the new system.

Once he achieved that, he said, he would go backwards in forwards between the different pieces until he has enough confidence that the new system does what it supposed to do.

Test Driven Analysis is just that as well.
I start with an idea in my head, think about reasonable checks and following that I (should) write down unit tests and only then start writing the analysis code. Finally I go backwards and forwards until I have gained enough evidence and confidence to present my output and be able to defend it.

Rich's presentation focused on the challenge of how to ensure that the new system (R) would provide the same answers as the legacy system (SAS).
This is when it clicked with me: My brain is just another system as well. Suppose you have an idea for an analysis in your head. Taking that idea and transforming it into code is basically just the same as migrating code from one system to another system. Or, isn't it?
Rich showed us how he does it: Start with the old code, write unit tests in the legacy system to confirm your understanding, re-write the unit tests in the new system and then start building the new analysis code in the new system.

Once he achieved that, he said, he would go backwards in forwards between the different pieces until he has enough confidence that the new system does what it supposed to do.

Test Driven Analysis is just that as well.
I start with an idea in my head, think about reasonable checks and following that I (should) write down unit tests and only then start writing the analysis code. Finally I go backwards and forwards until I have gained enough evidence and confidence to present my output and be able to defend it.
Test Driven Analysis

LondonR
,
R
,
SAS
,
Test Driven Analysis
Interactive pivot tables with R
I love interactive pivot tables. That is the number one reason why I keep using spreadsheet software. The ability to look at data quickly in lots of different ways, without a single line of code helps me to get an understanding of the data really fast.
Perhaps I can do the same now in R as well. At yesterday's LondonR meeting Enzo Martoglio presented briefly his

The following animated Gif from Nicolas' project page gives an idea of the interactive functionality of PivotTable.js.
Perhaps I can do the same now in R as well. At yesterday's LondonR meeting Enzo Martoglio presented briefly his
rpivotTable package. Enzo builds on Nicolas Kruchten's PivotTable.js JavaScript library that provides drag'n'drop functionality and wraps it with htmlwidget into R. The result is an interactive pivot table rendered in either your default browser or the viewer pane of RStudio with one line of code: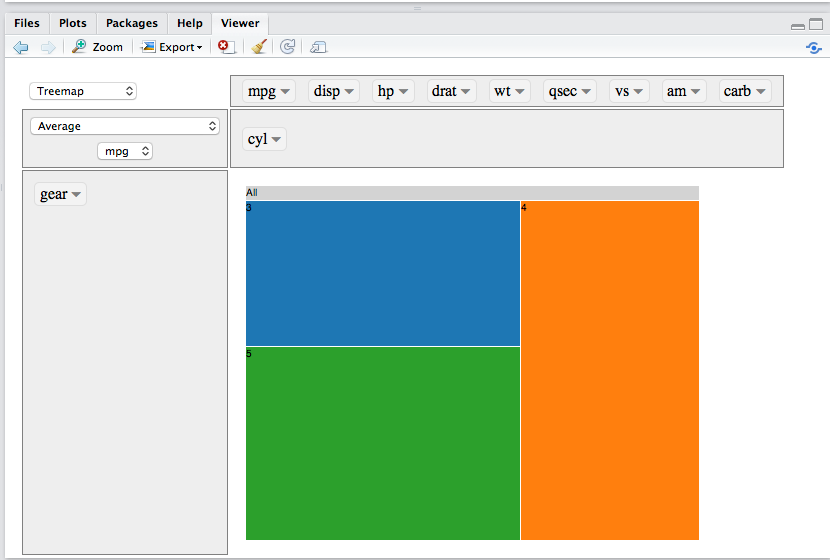
## Install packages
library(devtools)
install_github("ramnathv/htmlwidgets")
install_github("smartinsightsfromdata/rpivotTable")
## Load rpivotTable
library(rpivotTable)
data(mtcars)
## One line to create pivot table
rpivotTable(mtcars, rows="gear", col="cyl", aggregatorName="Average",
vals="mpg", rendererName="Treemap")
The following animated Gif from Nicolas' project page gives an idea of the interactive functionality of PivotTable.js.
 |
| Example of PivotTable.js Source: Nicolas Kruchten |
Session Info
R version 3.1.3 (2015-03-09)
Platform: x86_64-apple-darwin13.4.0 (64-bit)
Running under: OS X 10.10.2 (Yosemite)

locale:
[1] en_GB.UTF-8/en_GB.UTF-8/en_GB.UTF-8/C/en_GB.UTF-8/en_GB.UTF-8

attached base packages:
[1] stats     graphics  grDevices utils
[5] datasets  methods   base

other attached packages:
[1] rpivotTable_0.1.3.4

loaded via a namespace (and not attached):
[1] digest_0.6.8      htmltools_0.2.6
[3] htmlwidgets_0.3.2 RJSONIO_1.3-0
[5] tools_3.1.3       yaml_2.1.13
LondonR
,
News
,
PivotTable
,
R
ChainLadder 0.2.0 adds Solvency II CDR functions
ChainLadder is an R package that provides statistical methods and models for claims reserving in general insurance.
With version 0.2.0 we added new functions to estimate the claims development result (CDR) as required under Solvency II. Special thanks to Alessandro Carrato, Giuseppe Crupi and Mario Wüthrich who have contributed code and documentation.
For further details see package vignette and the help pages of the respective functions.

Michael Merz and Mario V. Wüthrich. Claims run-off uncertainty: the full picture. SSRN Manuscript, 2524352, 2014.
With version 0.2.0 we added new functions to estimate the claims development result (CDR) as required under Solvency II. Special thanks to Alessandro Carrato, Giuseppe Crupi and Mario Wüthrich who have contributed code and documentation.
New Features
- New generic function
CDRto estimate the one year claims development result. S3 methods for the Mack and bootstrap model have been added already:
- New function
tweedieReserveto estimate reserves in a GLM framework, including the one year claims development result. - Package vignette has a new chapter on One Year Claims Development Result
- New example data
MW2008andMW2014form the Merz & Wüthrich (2008, 2014) papers
Changes
- Source code development moved from Google Code to GitHub
as.data.frame.trianglenow gives warning message when dev. period is a character.- Alessandro Carrato, Giuseppe Crupi and Mario Wüthrich have been added as authors, thanks to their major contribution to code and documentation.
- Christophe Dutang, Arnaud Lacoume and Arthur Charpentier have been added as contributors, thanks to their feedback, guidance and code contribution.
Examples
The examples below use the triangle of the 2008 Merz & Wüthrich paper and illustrate how the one year claims development result can be estimated using the newCDR function for output of MackChainLadder and BootChainLadder. Also the tweedieReserve function is demonstrated, which can estimate the one year CDR as well, by setting the argument rereserving to TRUE.For further details see package vignette and the help pages of the respective functions.

References
Michael Merz and Mario V. Wüthrich. Modelling the claims development result for solvency purposes. CAS E-Forum, Fall:542–568, 2008Michael Merz and Mario V. Wüthrich. Claims run-off uncertainty: the full picture. SSRN Manuscript, 2524352, 2014.
Session Info
R version 3.1.3 (2015-03-09)
Platform: x86_64-apple-darwin13.4.0 (64-bit)
Running under: OS X 10.10.2 (Yosemite)

locale:
[1] en_GB.UTF-8/en_GB.UTF-8/en_GB.UTF-8/C/en_GB.UTF-8/en_GB.UTF-8

attached base packages:
[1] stats graphics grDevices utils datasets methods base

other attached packages:
[1] ChainLadder_0.2.0 statmod_1.4.20 systemfit_1.1-14 lmtest_0.9-33
[5] zoo_1.7-12        car_2.0-25     Matrix_1.1-5

loaded via a namespace (and not attached):
 [1] acepack_1.3-3.3     actuar_1.1-8        cluster_2.0.1
 [4] colorspace_1.2-6    digest_0.6.8        foreign_0.8-63
 [7] Formula_1.2-0       ggplot2_1.0.0       grid_3.1.3
[10] gtable_0.1.2        Hmisc_3.15-0        lattice_0.20-30
[13] latticeExtra_0.6-26 lme4_1.1-7          MASS_7.3-39
[16] mgcv_1.8-5          minqa_1.2.4         munsell_0.4.2
[19] nlme_3.1-120        nloptr_1.0.4        nnet_7.3-9
[22] parallel_3.1.3      pbkrtest_0.4-2      plyr_1.8.1
[25] proto_0.3-10        quantreg_5.11       RColorBrewer_1.1-2
[28] Rcpp_0.11.5         reshape2_1.4.1      rpart_4.1-9
[31] sandwich_2.3-2      scales_0.2.4        SparseM_1.6
[34] splines_3.1.3       stringr_0.6.2       survival_2.38-1
[37] tools_3.1.3         tweedie_2.2.1
ChainLadder
,
Insurance
,
R
,
reserving
R in Insurance: Abstract submission closes end of March
Hurry! The abstract submission deadline for the 3rd R in Insurance conference in Amsterdam, 29 June 2015 is approaching soon.

You have until the 28th of March to submit a one-page abstract for consideration. Both academic and practitioner proposals related to R are encouraged. Please email your abstract of no more than 300 words (in text or pdf format) to r-in-insurance@uva.nl.
The intended audience of the conference includes both academics and practitioners who are active or interested in the applications of R in insurance.
Invited talks will be given by:
Special thanks to our sponsors again: Rstudio, Cybea, Applied AI, Milliman, QBE, AEGON and Delta Lloyd Amsterdam.
Btw, notes from last year's conference were published in the R Journal.
You have until the 28th of March to submit a one-page abstract for consideration. Both academic and practitioner proposals related to R are encouraged. Please email your abstract of no more than 300 words (in text or pdf format) to r-in-insurance@uva.nl.
The intended audience of the conference includes both academics and practitioners who are active or interested in the applications of R in insurance.
Invited talks will be given by:
- Prof. Richard Gill, Leiden University
- Dr James Guszcza, FCAS, Chief Data Scientist, Deloitte - US
Special thanks to our sponsors again: Rstudio, Cybea, Applied AI, Milliman, QBE, AEGON and Delta Lloyd Amsterdam.
Btw, notes from last year's conference were published in the R Journal.


