Showing posts with label Kölner R Users. Show all posts
Showing posts with label Kölner R Users. Show all posts
Notes from the Kölner R meeting, 14 October 2016
Last Friday the Cologne R user group came together for two talks and a quiz at Eye/o, the company behind Adblock Plus, in Köln-Ehrenfeld. Eye/o were a great host, offering nibbles and drinks to warm up the event and pizza at the end.
The first talk was given by Jiddu Alexander, a physicist turned freelance data scientist. Jiddu gave an introduction into the tidyverse. He presented the concept of tidy data, and how the
Next up was Nils Glück to share his experience on performance profiling. R code often grows from a small idea for a specific task to a longer and longer script as more and more ideas and use cases are added. Occasionally, we end up with a long and poorly documented script that 'does the job' but has become slow. Finding the bottlenecks and addressing them is good short term remedy. Nils showed us how the
To bridge the time for the pizzas to arrive our host Kirill had prepared a little R quiz: Could we guess the output of simple R statements? Well, it is more difficult than you might think. Kirill had a great selection of quirky one-liners, which he had collected over time and borrowed from the fabulous R Inferno book by Pat Burns.
Please get in touch, if you would like to present at the next meeting.
 |
| Cologne R user meeting at Eye/o |
tidyverse bundle can be used to manage multiple models. Furthermore, he explained the concept of learning curves for model selection. Jiddu's slides are available from his web site. |
| Jiddu Alexander explaining learning curves |
Next up was Nils Glück to share his experience on performance profiling. R code often grows from a small idea for a specific task to a longer and longer script as more and more ideas and use cases are added. Occasionally, we end up with a long and poorly documented script that 'does the job' but has become slow. Finding the bottlenecks and addressing them is good short term remedy. Nils showed us how the
Rprof function of the utils package can be used to understand the performance profile of R code. Furthermore, the microbenchmark package with a function of the same name can then be used to test new approaches for a code block. |
| Nils Glück quoting others who are not bothered about performance |
To bridge the time for the pizzas to arrive our host Kirill had prepared a little R quiz: Could we guess the output of simple R statements? Well, it is more difficult than you might think. Kirill had a great selection of quirky one-liners, which he had collected over time and borrowed from the fabulous R Inferno book by Pat Burns.
Next Kölner R meeting
The next meeting will be scheduled in about three months time. Details will be published on our Meetup site. Thanks again to Eye/o for their support.Please get in touch, if you would like to present at the next meeting.
Kölner R Users
,
KölnR
,
R
,
tidyverse
Next Kölner R User Meeting: Friday 14 October

The 19th Cologne R user group meeting is scheduled for this Friday, 14 October 2016. We have three talks, followed by networking drinks.
- Introduction to the tidyverse tools - Jiddu Alexander
- Performance profiling and improvement in R - Nils Glück
- Batch processing of R-Scripts with Excel - Klaus Jacobi
For further details visit our KölnRUG Meetup site.
Notes from past meetings are available here.
Kölner R Users
,
KölnR
,
News
,
R
Notes from the Kölner R meeting, 9 July 2016
Last Thursday the Cologne R user group came together again. This time, our two speakers arrived from Bavaria, to talk about Spark and R Server.
Dubravko Dulic gave an introduction to Apache Spark and why Spark might be of interest to data scientists using R. Spark is designed for cluster computing, i.e. to distribute jobs across several computers. Not all tasks in R can be split easily across several nodes in a cluster, but if you use functions like
Since the acquisition of Revolution Analytics in 2015, Microsoft has been busy integrating R into its product offerings. Stefan Cronjaeger gave an overview of how R can be integrated into a production environment. Microsoft R server aims to solve the problem of doing 'big data' analytics with R, which allows to carrying out in-memory and disk-based data analysis. Additional new tools are called ScaleR for big data and parallelized analytics, ConnectR to connect to various other data sources, DistributedR for grid computing. Finally, Stefan showed us how Visual Studio can be used as an R development environment, similar to RStudio.
Please get in touch, if you would like to present at the next meeting.
Introduction to Apache Spark
 |
| Download slides |
by in R, then it is most likely doable. The by function in R splits a data set into several subsets and applies a specific function to each subgroup and collects the results in the end. In the world of Hadoop, this is called MapReduce. Spark has an advanced DAG (directed acyclic graph) execution engine that supports cyclic data flow and in-memory computing. Additionally, Spark has a direct API for R, which makes it relatively ease to write applications with Spark.Microsoft R Server
 |
| Download slides |
Next Kölner R meeting
The next meeting will be scheduled in about three months time. Details will be published on our Meetup site. Thanks again to Microsoft for their support.Please get in touch, if you would like to present at the next meeting.
Notes from the Kölner R meeting, 26 February 2016
Last Friday the Cologne R user group came together for the 17th time. This time, we were in for a special treatment, with two talks by psychologists!
But, there was nothing to fear, we were in safe hands, and for the first time, we met at the new Microsoft office in Cologne.
First up was Meik Michalke from the University of Düsseldorf presenting the RKWard project. RKWard is a graphical user interface and integrated development environment for statistical analysis with R. RKWard is a fully featured and extendable environment for R, available on all platforms. Furthermore, as Meik demonstrated, it is very straightforward to build new plugins for RKWard. These plugins can extend the user interface, which is great if you build tools for people who are less familiar with R, but perhaps more with SPSS. Meik is one of the developers of RKWard and he uses it to run an analysis, develop packages and to teach statistics.
Next up was Paul-Christian Bürkner from the University of Münster, presenting an overview of his
Following the talks, there was still plenty of time for questions and networking. Microsoft provided us with a great venue and enough drinks to keep us going until finally our stomachs asked for food and, dare I say it, Kölsch. As a result some of us ended up in Rheinau, a nice gastropub around the corner.
Please get in touch, if you would like to present at the next meeting.
But, there was nothing to fear, we were in safe hands, and for the first time, we met at the new Microsoft office in Cologne.
 |
| Lecture room at Microsoft, Cologne |
First up was Meik Michalke from the University of Düsseldorf presenting the RKWard project. RKWard is a graphical user interface and integrated development environment for statistical analysis with R. RKWard is a fully featured and extendable environment for R, available on all platforms. Furthermore, as Meik demonstrated, it is very straightforward to build new plugins for RKWard. These plugins can extend the user interface, which is great if you build tools for people who are less familiar with R, but perhaps more with SPSS. Meik is one of the developers of RKWard and he uses it to run an analysis, develop packages and to teach statistics.
 |
| Download slides |
Next up was Paul-Christian Bürkner from the University of Münster, presenting an overview of his
brms package. The name is short for Bayesian regression models with Stan. Although the package is still less than one-year-old, it is already quite mature, allowing the user to specify regression models in the usual R formula syntax. brms takes those formula calls, writes out the Stan code, compiles and runs the model, and it also provides methods to plot and predict brms models. Hence, it is a great way to get started with Stan and to build more complex Bayesian models.  |
| Download slides |
Following the talks, there was still plenty of time for questions and networking. Microsoft provided us with a great venue and enough drinks to keep us going until finally our stomachs asked for food and, dare I say it, Kölsch. As a result some of us ended up in Rheinau, a nice gastropub around the corner.
Next Kölner R meeting
The next meeting will be scheduled in about three months time. Details will be published on our Meetup site. Thanks again to Microsoft for their support.Please get in touch, if you would like to present at the next meeting.
brms
,
Koelner R User
,
Kölner R Users
,
R
,
RKward
Next Kölner R User Meeting: Friday, 26 Feburary 2016
The 17th Cologne R user group meeting is scheduled for this Friday, 26 February 2016. We have two talks, followed by networking drinks.
- Introduction to Bayesian Regression Models using Stan with the brms package - Paul-Christian Bürkner (Uni Münster)
- RKWard: A Graphical User Interface and Integrated Development Environment for Statistical Analysis with R - Meik Michalke (Uni Düsseldorf)
For further details visit our KölnRUG Meetup site. Unfortunately, this event is already fully booked, but please sign up if you would like to come along to future events.
Notes from past meetings are available here.
Kölner R Users
,
KölnR
,
News
,
R
Next Kölner R User Meeting: Friday, 4 December 2015
The 16th Cologne R user group meeting is scheduled for this Friday, 4 December 2015 and we have great line up with three talks followed by networking drinks.
- Monitoring process change using Bayesian methods (Mick Cooney)
A common business problem is to evaluate the effect of a change of process, and this talk will discuss a straightforward approach to this using conjugate priors.
- Editing R files with DataJoy (Dietmar Janetzko)
Brief introduction to the online collaborative data analysis platform DataJoy.
- Emoticons decoder for social media sentiment analysis in R (Jessica Peterka-Bonetta)
While R seems to be able to display some emoticons properly, many other times it doesn’t, making any further analysis impossible unless you get rid of them. With a little hack, I decoded these emoticons and put them all in a dictionary for further use.
Drinks and Networking
The event will be followed by drinks (Kölsch!) and networking opportunities.For further details visit our KölnRUG Meetup site. Please sign up if you would like to come along. Notes from past meetings are available here.
The organisers, Kirill Pomogajko and Markus Gesmann, gratefully acknowledge the sponsorship of Revolution Analytics, who support the Cologne R user group as part of their Matrix programme.
Kölner R Users
,
KölnR
,
News
,
R
Notes from the Kölner R meeting, 18 September 2015
Last Friday the Cologne R user group came together for the 15th time. Since its inception over three years ago the group evolved from a small gathering in a pub into an active data science community, covering wider topics than just R. Still, R is the link and clue between the different interests. Last Friday's agenda was a good example of this, with three talks touching on workflow management, web development and risk analysis.
Yuki Katoh had travelled all the way from Berlin to present on how to embed R with
Kicking off the luigi script starts the workflow, and
Shiny is a very popular R package that allows users to develop interactive browser applications. Paul Viefers introduced us to the extension
Paul showed us an example of a shinyapp that depending on the user plotted a different graph. Behind the scene his script would either hide or shows those plots, conditioned on the user. With only a few lines in R it allowed him to develop a user specific application. To achieve this he created a login screen that checks for user name and password. In his example he had hard coded the login credentials, instead of using a secure connection via a professional shiny server instance. However this was sufficient for his purpose, where he tests how students react to different economic scenarios in a lab environment at university.
The last talk of the meeting had a more statistical focus with examples from insurance. I repeated my talk from the LondonR user group meeting in June. One of the challenge in insurance is that despite of having many customers , insurance companies will have little claims data per customer to assess risks.
I presented some Bayesian ideas to analyse risks with little data. I used the wonderful "Hit and run accident" example from Daniel Kahneman's book Thinking, fast and slow to explain Bayes' formula, introduced Bayesian belief networks for a claims analysis and discussed the challenge of predicting events when they haven't happened yet (also in Stan). Along the way I mentioned a few ideas on communicating risk, which I learned from David Spiegelhalter earlier this year.
Please get in touch, if you would like to present at the next meeting.
R in a big data pipeline
 |
| Download slides |
luigi into a heterogeneous workflow of different applications. This is especially useful when R needs to be integrated with hadoop/hdfs based technologies, such as Spark and Hive. Luigi is not unlike Make, which Kirill presented at our last meeting in June. In a configuration file Yuki specified the various workflow steps and dependencies between the jobs.Kicking off the luigi script starts the workflow, and
luigid server allows Yuki to monitor the various parts of the dependency graph visually. Thus, he can see the progress of his workflow in real time and identify quickly, when and where a sub process fails. As Yuki pointed out, this becomes critical in production systems, where failures need to be known and fixed quickly, unlike when ones carries out an explorative analysis in a development/research environment. See also Yuki's blog post for further details.Shiny + Shinyjs
 |
| Download presentation files |
shinyjs, a package written by Dean Attali. The name suggests already that the package provides additional JavaScript functionality. Indeed, it does, but without the need to learn JavaScript, as those functions are wrapped into R. Paul showed us an example of a shinyapp that depending on the user plotted a different graph. Behind the scene his script would either hide or shows those plots, conditioned on the user. With only a few lines in R it allowed him to develop a user specific application. To achieve this he created a login screen that checks for user name and password. In his example he had hard coded the login credentials, instead of using a secure connection via a professional shiny server instance. However this was sufficient for his purpose, where he tests how students react to different economic scenarios in a lab environment at university.
Experience vs. Data
 |
| Download slides |
I presented some Bayesian ideas to analyse risks with little data. I used the wonderful "Hit and run accident" example from Daniel Kahneman's book Thinking, fast and slow to explain Bayes' formula, introduced Bayesian belief networks for a claims analysis and discussed the challenge of predicting events when they haven't happened yet (also in Stan). Along the way I mentioned a few ideas on communicating risk, which I learned from David Spiegelhalter earlier this year.
Next Kölner R meeting
The next meeting will be scheduled in December. Details will be published on our Meetup site. Thanks again to Revolution Analytics/Microsoft for their sponsorship.Please get in touch, if you would like to present at the next meeting.
Insurance
,
Koelner R User
,
Kölner R Users
,
luigi
,
R
,
shinyjs
Next Kölner R User Meeting: Friday, 18 September 2015
The 15th Cologne R user group meeting is scheduled for this Friday, 18 September 2015 and we have a full agenda with three talks followed by networking drinks.
- R in big data pipeline with luigi (Yuki Katoh)
R in big data pipeline: Put your awesome R codes into production. Learn how to build solid big data pipeline around it.
- shinyjs (Paul Viefers)
Using JavaScript in shiny, without knowing JavaScript
- Experience vs Data (Markus Gesmann)
How to asses risks with small data sets. Bayesian ideas, belief networks and a small simulation example in Stan/rstan.
Drinks and Networking
The event will be followed by drinks (Kölsch!) and networking opportunities.For further details visit our KölnRUG Meetup site. Please sign up if you would like to come along. Notes from past meetings are available here.
The organisers, Kirill Pomogajko and Markus Gesmann, gratefully acknowledge the sponsorship of Revolution Analytics, who support the Cologne R user group as part of their Matrix programme.
Kölner R Users
,
KölnR
,
News
,
R
Notes from the Kölner R meeting, 26 June 2015
Last Friday the Cologne R user group came together for the 14th time. For the first time we met at Startplatz, a start-up incubator venue. The venue was excellent, not only did they provide us with a much larger room, but also with table-football and drinks. Many thanks to Kirill for organising all of this!
We had two excellent advanced talks. Both were very informative and well presented.
Imagine you have several servers that generate large data sets with no standard delimiters, like the example below.
The columns appear to be separated by a blank at first glance, but the second column (Military) has strings such as Air Force that include a blank itself. Furthermore, other columns have missing data (Month) and another uses speech-marks (Car). Thus, it's messy and difficult to read into R.
To solve the problem Kirill developed a Makefile that uses tools such as
Kirill's tutorial files are available via GitHub.
Paul Viefers gave a great introduction to Stan and RStan, with a focus on explaining the differences to other MCMC packages such as JAGS.
Stan is a probabilistic programming language for Bayesian inference. One of the major challenges in Bayesian analysis is that often there is no analytical solution for the posterior distribution. Hence, the posterior distribution is approximated via simulations, such as Gibbs sampling in JAGS. Stan, on the other hand, uses Hamiltonian Monte Carlo (HMC), an algorithm that is more subtle in proposing jumps, using more structure by translation into Hamiltonian mechanics framework.
Paul ended his talk by walking us through the various building blocks of a Stan script, using a hierarchical logistic regression example.
You can access Paul's slides on RPubs.

 |
| Photo: Günter Faes |
Data Science at the Command Line
Kirill Pomogajko showed us how he uses various command line tools to pre-process log-files for further analysis with R. |
| Photo: Günter Faes |
The columns appear to be separated by a blank at first glance, but the second column (Military) has strings such as Air Force that include a blank itself. Furthermore, other columns have missing data (Month) and another uses speech-marks (Car). Thus, it's messy and difficult to read into R.
To solve the problem Kirill developed a Makefile that uses tools such as
scp, sed and awk to download and clean the server files. Kirill's tutorial files are available via GitHub.
An Introduction to RStan and the Stan Modelling Language
Paul Viefers gave a great introduction to Stan and RStan, with a focus on explaining the differences to other MCMC packages such as JAGS.
 |
| Photo: Günter Faes |
Stan is a probabilistic programming language for Bayesian inference. One of the major challenges in Bayesian analysis is that often there is no analytical solution for the posterior distribution. Hence, the posterior distribution is approximated via simulations, such as Gibbs sampling in JAGS. Stan, on the other hand, uses Hamiltonian Monte Carlo (HMC), an algorithm that is more subtle in proposing jumps, using more structure by translation into Hamiltonian mechanics framework.
Paul ended his talk by walking us through the various building blocks of a Stan script, using a hierarchical logistic regression example.
You can access Paul's slides on RPubs.
Drinks and Networking
No Cologne R user group meeting is complete without Kölsch and networking. In the end some of us ended up in a fancy burger place.
Next Kölner R meeting
The next meeting will be scheduled in September. Details will be published on our Meetup site. Thanks again to Revolution Analytics for their sponsorship.
Koelner R User
,
Kölner R Users
,
make
,
R
,
rstan
Next Kölner R User Meeting: Friday, 26 June 2015
The next Cologne R user group meeting is scheduled for this Friday, 6 June 2015 and we have an exciting agenda with two talks followed by networking drinks.
- Data Science at the Commandline (Kirill Pomogajko)
- An Introduction to RStan and the Stan Modelling Language (Paul Viefers)
Drinks and Networking
The event will be followed by drinks (Kölsch!) and networking opportunities.For further details visit our KölnRUG Meetup site. Please sign up if you would like to come along. Notes from past meetings are available here.
The organisers, Bernd Weiß and Markus Gesmann, gratefully acknowledge the sponsorship of Revolution Analytics, who support the Cologne R user group as part of their Matrix programme.
Kölner R Users
,
KölnR
,
News
,
R
Notes from the Kölner R meeting, 6 March 2015
At last Friday's Cologne R user group meeting we welcomed two Northerners from the left and right (or 'right' and 'wrong') side of the Rhine.
Günter and Michael presented examples of a new R Excel plugin 'Calidris' they developed using R.net. The plugin itself is written in C# and adds an R ribbon to Excel with pre-build functions.

In its current form the add-in is a proof of concept. It demonstrates in principal that functions based on R can be added to Excel. The version Günter and Michael demonstrated doesn't have a reactive functionality yet, i.e. updating a cell will not update the output of an R function automatically at the moment. Feel free to get in touch with them if you would like to know more about their project. You find their contact details on the last slide of their presentation.
Cornelius gave an engaging high-level overview on text mining with R, covering:
A nice and illustrative example Cornelius presented at the end of his talk was the package
Using R in Excel via R.NET
Günter Faes and Matthias Spix |
| Download slides |
Günter and Michael presented examples of a new R Excel plugin 'Calidris' they developed using R.net. The plugin itself is written in C# and adds an R ribbon to Excel with pre-build functions.

In its current form the add-in is a proof of concept. It demonstrates in principal that functions based on R can be added to Excel. The version Günter and Michael demonstrated doesn't have a reactive functionality yet, i.e. updating a cell will not update the output of an R function automatically at the moment. Feel free to get in touch with them if you would like to know more about their project. You find their contact details on the last slide of their presentation.
Text Mining with R
Cornelius Puschmann |
| Download slides |
Cornelius gave an engaging high-level overview on text mining with R, covering:
- From natural language processing (NLP) to text mining
- Building corpora
- Latent semantic analysis (LSA)
- Topic models/Latent Dirichlet allocation (LDA)
- Sentiment analysis
- Misc useful packages
A nice and illustrative example Cornelius presented at the end of his talk was the package
gender by Linclon Mullen that uses historical US census data to predict the gender of people based on their first name. I have several colleagues with the name of 'Leslie' or 'Lesley'. Thanks to gender I know now that my male colleagues are more likely to be spelled 'Leslie' than 'Lesley' and that a person with either name is more likely to be female.library(gender)
L1 <- gender("Leslie")
L2 <- gender("Lesley")
cbind(L1, L2)
L1 L2
name "Leslie" "Lesley"
proportion_male 0.2222 0.0995
proportion_female 0.7778 0.9005
gender "female" "female"
year_min 1932 1932
year_max 2012 2012
Drinks and Networking
No Cologne R user group meeting would be complete without drinks and schnitzel at the Lux. |
| Photo: Günter Faes |
Next Kölner R meeting
The next meeting will be Friday, 26 June. Note the new larger venue: Startplatz, Im Mediapark 5, Köln. We will have two talks:- Data Science at the Commandline (Kirill Pomogajko)
- An Introduction to RStan and the Stan Modelling Language (Paul Viefers)
Excel
,
Koelner R User
,
Kölner R Users
,
R
,
R.net
,
text mining
Next Kölner R User Meeting: Friday, 6 March 2015
The next Cologne R user group meeting is scheduled for this Friday, 6 March 2015 and we have an exciting agenda with two talks, followed by networking drinks:
Using R in Excel via R.NET
Günter Faes and Matthias SpixMS Office and Excel are the 'de-facto' standards in many industries. Using R with Excel offers an opportunity to combine the statistical power of R with a familiar user interface. R.net offers a user friendly interfaces to Excel; R functions work just like Excel functions and are basically hidden away.
Text Mining with R
Cornelius PuschmannIn addition to the analysis of numerical data, R is increasingly attractive for processing text as well. Cornelius will give a very brief overview of common text mining techniques and their corresponding R implementations, with a focus on useful applications in the social sciences. Techniques will include corpus creation and management (package tm), latent semantic analysis (package lsa), and topic models (package topicmodels), as well as sentiment analysis (experimental package syuzhet). Simple but useful routines such as automatically inferring the language of a text (package text cat , or the gender of a first name (package genderize) will also be briefly pointed out.
Drinks and Networking
The event will be followed by drinks and schnitzel at the Lux.For further details visit our KölnRUG Meetup site. Please sign up if you would like to come along. Notes from past meetings are available here.
The organisers, Bernd Weiß and Markus Gesmann, gratefully acknowledge the sponsorship of Revolution Analytics, who support the Cologne R user group as part of their Matrix programme.
View Larger Map
Notes from the Kölner R meeting, 12 December 2014
Last week's Cologne R user group meeting was the best attended so far, and it was a remarkable event - I believe not a single line of R code was shown. Still, it was an R user group meeting with two excellent talks, and you will understand shortly why not much R code needed to be displayed.
Hans Werner Borchers joined us from Mannheim to give an introduction to Julia for R users. Julia is a high-level, high-performance dynamic programming language for technical computing. The language has gained some considerable traction over the last two years and it was great to get an overview from a familiar perspective.
Interestingly, as Hans Werner pointed out, Julia is by far not the only new language around the block. Indeed, over the last decade nearly every year saw the announcement of a new language. Also big tech companies such as Microsoft, Google, Mozilla and Apple are trying to push their own programming languages: F# (2005), Go (2009), Rust (2010) and Swift (2014) respectively.
Over the more recent years we notice a movement towards the use of LLVM (Low Level Virtual Machine), on which Julia is based as well and which makes it fast. The just in time compilation demands a little mind shift if you come from R, where the mantra for speed is: vectorise - remove all for-loops. Well, the opposite is true for Julia, because your code will be compiled. For-loops are much easier to understand for the underlying compiler. Hans Werner's slides provide some good examples to get you started and pointers to further resources.
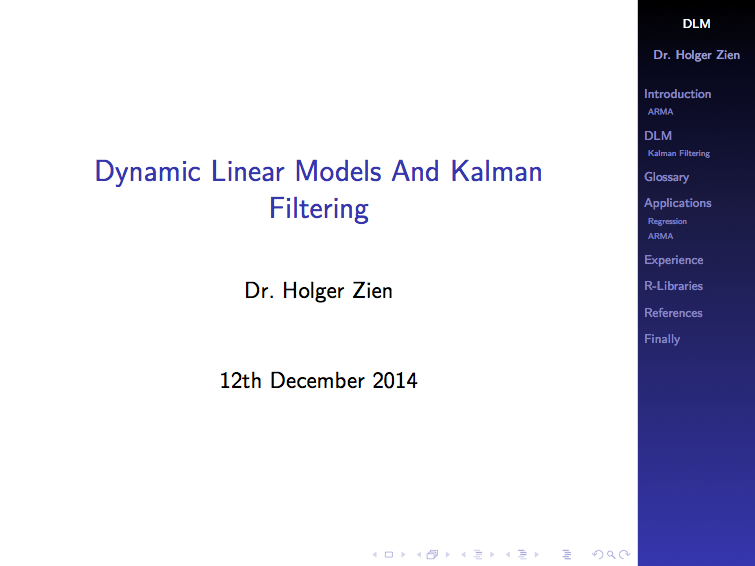
Forecasting time series was the topic of Holger Zien's talk. Holger gained his first experience with time series during his PhD, when he worked with experimental sensor data. That meant he had lots of data, which could often be regarded stationary as well.
Nowadays, his challenges can be very different, sometimes only a few data points from a non-stationary process are available, and yet he is still expected to predict the future.
Dynamic linear models (dlm) can provide a remedy in those situations. In their simplest version a dlm links system and observational equations in the following way:
\[
y_t = F \theta_t + \nu_t\quad\mbox{observation eq. }\\
\theta_t = G \theta_{t-1} + \omega_t\quad\mbox{system eq.}
\] with \(\nu_t, \omega_t\) mutually independent random variables. A special case of dynamic linear models is the well known Kalman filter. In the more general case \(y_t\) and \(\theta_t\) are vectors and \(F_t, G_t\) are time variant matrices.
Holger explained that a dlm can principally be used for three purposes:
Please get in touch if you would like to present and share your experience, or indeed if you have a request for a topic you would like to hear more about. For more details see also our Meetup page.
Thanks again to Bernd Weiß for hosting the event and Revolution Analytics for their sponsorship.
Introduction to Julia for R Users
 |
| Download slides |
Interestingly, as Hans Werner pointed out, Julia is by far not the only new language around the block. Indeed, over the last decade nearly every year saw the announcement of a new language. Also big tech companies such as Microsoft, Google, Mozilla and Apple are trying to push their own programming languages: F# (2005), Go (2009), Rust (2010) and Swift (2014) respectively.
Over the more recent years we notice a movement towards the use of LLVM (Low Level Virtual Machine), on which Julia is based as well and which makes it fast. The just in time compilation demands a little mind shift if you come from R, where the mantra for speed is: vectorise - remove all for-loops. Well, the opposite is true for Julia, because your code will be compiled. For-loops are much easier to understand for the underlying compiler. Hans Werner's slides provide some good examples to get you started and pointers to further resources.
Dynamic Linear Models and Kalman Filtering
 |
| Download slides |
Nowadays, his challenges can be very different, sometimes only a few data points from a non-stationary process are available, and yet he is still expected to predict the future.
Dynamic linear models (dlm) can provide a remedy in those situations. In their simplest version a dlm links system and observational equations in the following way:
\[
y_t = F \theta_t + \nu_t\quad\mbox{observation eq. }\\
\theta_t = G \theta_{t-1} + \omega_t\quad\mbox{system eq.}
\] with \(\nu_t, \omega_t\) mutually independent random variables. A special case of dynamic linear models is the well known Kalman filter. In the more general case \(y_t\) and \(\theta_t\) are vectors and \(F_t, G_t\) are time variant matrices.
Holger explained that a dlm can principally be used for three purposes:
- Filtering: Estimate of the current value of the state/system variable.
- Smoothing: Estimate of past values of the state/system variable, i.e., estimating at time \(t\) given measurements up to time \(t' > t\).
- Forecasting: Forecasting future observations or values of the state/system variable.
Next Kölner R meeting
The next meeting is scheduled for 6 March 2015.Please get in touch if you would like to present and share your experience, or indeed if you have a request for a topic you would like to hear more about. For more details see also our Meetup page.
Thanks again to Bernd Weiß for hosting the event and Revolution Analytics for their sponsorship.
Bayesian
,
dlm
,
Julia
,
Kalman
,
Koelner R User
,
Kölner R Users
,
R
Next Kölner R User Meeting: Friday, 12 December 2014
The next Cologne R user group meeting is scheduled for this Friday, 12 December 2014.
We have an exciting agenda with two talks on Julia and Dynamic Linear Models:
Introduction to Julia for R Users
Hans Werner BorchersJulia is a high-performance dynamic programming language for scientific computing, with a syntax that is familiar to users of other technical computing environments (Matlab, Python, R, etc.). It provides a sophisticated compiler, high performance with numerical accuracy, and extensive mathematical function libraries.
Some of the highlights of Julia are an implementation of automated differentiation, an optimisation modelling language, also integrating some of the optimisation solvers available from the COIN-OR project, and user-contributed packages for time series, statistics and machine learning, or operations research.
Dynamic Linear Models and Kalman Filtering
Holger ZienOne of the problems most commonly presented to everybody working in statistics is forecasting time series. The textbook answer is to fit an ARMA model to the data and to use the model for prediction. This approach works well for long and stationary time series. However, often the actual time series one is given to analyse are more complicated. They are ridiculously short and clearly non-stationary. Dynamic Linear Models (DLM) and Kalman Filtering go one step beyond ARMA models and may be applied to these more complicated data. I will give a brief introduction into their mathematical background and will talk about my experience using them in practice.
Drinks and Networking
The event will be followed by drinks and schnitzel at the Lux.For further details visit our KölnRUG Meetup site. Please sign up if you would like to come along. Notes from past meetings are available here.
The organisers, Bernd Weiß and Markus Gesmann, gratefully acknowledge the sponsorship of Revolution Analytics, who support the Cologne R user group as part of their vector programme.
View Larger Map
Notes from the Kölner R meeting, 12 September 2014
Last Friday we had guests from Belgium and the Netherlands joining us in Cologne. Maarten-Jan Kallen from BeDataDriven came from The Hague to introduce us to Renjin, and the guys from DataCamp in Leuven, namely Jonathan, Martijn and Dieter, gave an overview of their new online interactive training platform.
DataCamp
,
Koelner R User
,
Kölner R Users
,
R
,
Renjin
Next Kölner R User Meeting: Friday, 12 September 2014
The next Cologne R user group meeting is scheduled for this Friday, 12 September 2014.
We have a great agenda with international speakers:
- Maarten-Jan Kallen: Introduction to Renjin, the R interpreter for the JVM
- Jonathan Cornelissen, Martijn Theuwissen: DataCamp - An online interactive learning platform for R
Kölner R Users
,
KölnR
,
News
,
R
Notes from the Kölner R meeting, 23 May 2014
The 10th Kölner R user meeting took place last Friday at the Institute of Sociology and to celebrate the anniversary we invited Andrie de Vries to join us from Revolution Analytics. Andrie is well known in the R community; he is the co-author of the R for Dummies book and an active contributor on stackoverflow.
Andrie talked about how R is finding its way into the enterprise. He argued that R has become the go-to tool for data and statistical analysis in many companies. He observed that over the years the commercial user base evolved from a small expert community with a love for the command line and cutting edge technology into a much wider audience. Although R is still used by the technical experts, who demand more and more power, out-of-memory computations on bigger data, etc. the number of casual R users is growing rapidly. Often the casual R user relies on code written by others as part of a bigger workflow and hence prefers a more standardised user interface.
Andrie illustrated how Revolution Analytics aims to satisfy both user groups. He started with the expert R users by demonstrating Revolution Analytics' RevoScaleR package that allows them to carry out analysis on bigger data. His example followed closely the airline analysis of Joseph Rickert's white paper. Andrie then showed how more complex R code and functions can be integrated (and to some extend hidden) into Alteryx and Tableau via Rserve.
I gave a brief introduction to googleVis and presented recent developments. The googleVis package provides an interface between R and the Google Chart Tools API. It allows users to create web pages with interactive charts based on R data frames and to display them either via the local R HTTP help server or within their own sites, without uploading the data to Google. The best known example is perhaps the motion chart of fertility and life expectancy data from the World Bank as first presented by Hans Rosling. Another popular example is the chart that illustrates the performance of the famous Lloyd's insurance market.
Since version 0.5.0 of googleVis many new chart types have been added to googleVis, including annotation, sankey, calendar and timeline charts. Additionally new markdown vignettes have been included to present the examples also on CRAN. The slides and rmarkdown code are available via GitHub.
Please get in touch if you would like to present and share your experience, or indeed if you have a request for a topic you would like to hear more about. For more details see also our Meetup page.
Thanks again to Bernd Weiß for hosting the event and Revolution Analytics for their sponsorship.
Taking R to the Enterprise
 |
| Andrie de Vries: Taking R to the Enterprise. Photo: Günter Faes |
Andrie talked about how R is finding its way into the enterprise. He argued that R has become the go-to tool for data and statistical analysis in many companies. He observed that over the years the commercial user base evolved from a small expert community with a love for the command line and cutting edge technology into a much wider audience. Although R is still used by the technical experts, who demand more and more power, out-of-memory computations on bigger data, etc. the number of casual R users is growing rapidly. Often the casual R user relies on code written by others as part of a bigger workflow and hence prefers a more standardised user interface.
Andrie illustrated how Revolution Analytics aims to satisfy both user groups. He started with the expert R users by demonstrating Revolution Analytics' RevoScaleR package that allows them to carry out analysis on bigger data. His example followed closely the airline analysis of Joseph Rickert's white paper. Andrie then showed how more complex R code and functions can be integrated (and to some extend hidden) into Alteryx and Tableau via Rserve.
googleVis overview & developments
 |
| Slides and code available on GitHub |
I gave a brief introduction to googleVis and presented recent developments. The googleVis package provides an interface between R and the Google Chart Tools API. It allows users to create web pages with interactive charts based on R data frames and to display them either via the local R HTTP help server or within their own sites, without uploading the data to Google. The best known example is perhaps the motion chart of fertility and life expectancy data from the World Bank as first presented by Hans Rosling. Another popular example is the chart that illustrates the performance of the famous Lloyd's insurance market.
Since version 0.5.0 of googleVis many new chart types have been added to googleVis, including annotation, sankey, calendar and timeline charts. Additionally new markdown vignettes have been included to present the examples also on CRAN. The slides and rmarkdown code are available via GitHub.
Kölsch & Schnitzel
No Kölner R meeting would be complete without a few Kölsch and Schnitzel at the Lux. We were lucky with the weather so that we could sit outside to enjoy drinks, food and networking opportunities. |
| Kölsch and Schnitzel at the Lux. Photo: Günter Faes |
Next Kölner R meeting
The next meeting is scheduled for 12 September 2014.Please get in touch if you would like to present and share your experience, or indeed if you have a request for a topic you would like to hear more about. For more details see also our Meetup page.
Thanks again to Bernd Weiß for hosting the event and Revolution Analytics for their sponsorship.
Next Kölner R User Meeting: Friday, 23 May 2014
The next Cologne R user group meeting is scheduled for this Friday, 23 May 2014.
To celebrate our 10th meeting we welcome:
Further details available on our KölnRUG Meetup site. Please sign up if you would like to come along. Notes from past meetings are available here.

The organisers, Bernd Weiß and Markus Gesmann, gratefully acknowledge the sponsorship of Revolution Analytics, who support the Cologne R user group as part of their vector programme.
View Larger Map
To celebrate our 10th meeting we welcome:
- Andrie de Vries (Revolution Analytics and Co-author of R for Dummies): Taking R to the Enterprise
- Markus Gesmann: googleVis overview and recent developments
Further details available on our KölnRUG Meetup site. Please sign up if you would like to come along. Notes from past meetings are available here.

The organisers, Bernd Weiß and Markus Gesmann, gratefully acknowledge the sponsorship of Revolution Analytics, who support the Cologne R user group as part of their vector programme.
View Larger Map
Kölner R Users
,
KölnR
,
News
,
R
Review: Kölner R Meeting 26 Feburary 2014
Last week's Cologne R user group meeting was all about R and databases. We had three talks from a generic overview on how to connect R to databases, to a specific example with kdb+ and perhaps the future with ArangoDB, a NoSQL database.


Please get in touch if you would like to present and share your experience, or indeed if you have a request for a topic you would like to hear more about. For more details see also our Meetup page.
Thanks again to Bernd Weiß for hosting the event and Revolution Analytics for their sponsorship.
Connecting R with databases
Diego de Castillo's talk focused on the use of relational databases, such as PostgreSQL, SQLite and Oracle. For all these databases dedicated R drivers exist on CRAN that can be used in a generic way via the DBI package. This allows for a consistent approach to connect, query and return data to R. A popular alternative on Windows to the DBI framework is the use of the ODBC (Open Database Connectivity) API via RODBC or RJDBC.R and kdb+
Kim Kuen Tang gave an overview of kdb+, a proprietary database that appears to be popular for time series data. kdb+ comes with its own expressive query language, q. Kim demonstrated how he could analyse large amount of stock market data stored in a kdb+ database using R and q all via sublime.ArangoDB
Michael Hackstein and Claudius Weinberger introduced us to ArangoDB, a NoSQL (Not only SQL) database. ArangoDB is an open source document database. This means that data is stored as documents, which are similar to JavaScript objects, in so-called "collections". Their slides presented nicely the different concepts outside the traditional relational databases, such as key values stores, document stores and graph data. Claudius mentioned that they had received several requests from users who wanted to connect R to ArangoDB. Although a native driver does not exist for R yet, ArangoDB can be accessed by R using the HTTP-API via the packages bitops, RCurl and RJSONIO.
Next Kölner R meeting
The next meeting is scheduled for 23 May 2014. This will be our 10th meeting, clearly something we need to celebrate!Please get in touch if you would like to present and share your experience, or indeed if you have a request for a topic you would like to hear more about. For more details see also our Meetup page.
Thanks again to Bernd Weiß for hosting the event and Revolution Analytics for their sponsorship.
arangoDB
,
database
,
kdb+
,
Koelner R User
,
Kölner R Users
,
R
Next Kölner R User Meeting: 26 February 2014
The next Cologne R user group meeting is scheduled for tomorrow, 26 February 2014. We are delighted to welcome:
Please sign up if you would like to come along. Notes from past meetings are available here.

The organisers, Bernd Weiß and Markus Gesmann, gratefully acknowledge the sponsorship of Revolution Analytics, who support the Cologne R user group as part of their vector programme.
View Larger Map
- Diego de Castillo: R and databases
- Kim Kuen Tang: Hands on using R and kdb+ together
- Frank Celler: ArangoDB (Lightning Talk)
Please sign up if you would like to come along. Notes from past meetings are available here.

The organisers, Bernd Weiß and Markus Gesmann, gratefully acknowledge the sponsorship of Revolution Analytics, who support the Cologne R user group as part of their vector programme.
View Larger Map
Kölner R Users
,
KölnR
,
News
,
R


