Showing posts with label News. Show all posts
Showing posts with label News. Show all posts
Next Kölner R User Meeting: Friday 14 October

The 19th Cologne R user group meeting is scheduled for this Friday, 14 October 2016. We have three talks, followed by networking drinks.
- Introduction to the tidyverse tools - Jiddu Alexander
- Performance profiling and improvement in R - Nils Glück
- Batch processing of R-Scripts with Excel - Klaus Jacobi
For further details visit our KölnRUG Meetup site.
Notes from past meetings are available here.
Kölner R Users
,
KölnR
,
News
,
R
googleVis 0.6.1 on CRAN
We released googleVis version 0.6.1 on CRAN last week. The update fixes issues with setting certain options, following the switch from
New to googleVis? The package provides an interface between R and the Google Charts Tools, allowing you to create interactive web charts from R without uploading your data to Google. The charts are displayed by default via the R internal help browser.
To lean more see the examples of googleVis charts on CRAN and read the introduction vignette.
RJSONIO to jsonlite.  |
| Screen shot of some of the Google Charts |
To lean more see the examples of googleVis charts on CRAN and read the introduction vignette.
Notes from the Kölner R meeting, 9 July 2016
Last Thursday the Cologne R user group came together again. This time, our two speakers arrived from Bavaria, to talk about Spark and R Server.
Dubravko Dulic gave an introduction to Apache Spark and why Spark might be of interest to data scientists using R. Spark is designed for cluster computing, i.e. to distribute jobs across several computers. Not all tasks in R can be split easily across several nodes in a cluster, but if you use functions like
Since the acquisition of Revolution Analytics in 2015, Microsoft has been busy integrating R into its product offerings. Stefan Cronjaeger gave an overview of how R can be integrated into a production environment. Microsoft R server aims to solve the problem of doing 'big data' analytics with R, which allows to carrying out in-memory and disk-based data analysis. Additional new tools are called ScaleR for big data and parallelized analytics, ConnectR to connect to various other data sources, DistributedR for grid computing. Finally, Stefan showed us how Visual Studio can be used as an R development environment, similar to RStudio.
Please get in touch, if you would like to present at the next meeting.
Introduction to Apache Spark
 |
| Download slides |
by in R, then it is most likely doable. The by function in R splits a data set into several subsets and applies a specific function to each subgroup and collects the results in the end. In the world of Hadoop, this is called MapReduce. Spark has an advanced DAG (directed acyclic graph) execution engine that supports cyclic data flow and in-memory computing. Additionally, Spark has a direct API for R, which makes it relatively ease to write applications with Spark.Microsoft R Server
 |
| Download slides |
Next Kölner R meeting
The next meeting will be scheduled in about three months time. Details will be published on our Meetup site. Thanks again to Microsoft for their support.Please get in touch, if you would like to present at the next meeting.
Notes from 2nd Bayesian Mixer Meetup
Last Friday the 2nd Bayesian Mixer Meetup (@BayesianMixer) took place at Cass Business School, thanks to Pietro Millossovich and Andreas Tsanakas, who helped to organise the event.
 |
| Bayesian Mixer at Cass |
First up was Davide De March talking about the challenges in biochemistry experimentation, which are often characterised by complex and emerging relations among components.
The very little prior knowledge about complex molecules bindings left a fertile field for a probabilistic graphical model. In particular, Bayesian networks can help the investigator in the definition of a conditional dependence/independence structure where a joint multivariate probability distribution is determined. Hence, the use of Bayesian network can lead to a more efficient way of designing experiments.
 |
Davide De March: Bayesian Networks to design optimal experiments |
The second act of the night was Mick Cooney, presenting ideas of using growth curves to estimate the ultimate amounts paid in insurance by some cohort of policies.
The talk showed a model for these curves, discussed the implementation in Stan and how posterior predictive checks can be used to assess the output of the model.
 |
| Mick Cooney: Bayesian Modelling for Loss Curves in Insurance |
Thanks again to everyone who helped to make the event a success, particularly our speakers and Jon Sedar of Applied AI.
We are planning to run another event in mid-June. Please get in touch via our Meetup site with ideas and talk proposals.
Next Kölner R User Meeting: Friday, 26 Feburary 2016
The 17th Cologne R user group meeting is scheduled for this Friday, 26 February 2016. We have two talks, followed by networking drinks.
- Introduction to Bayesian Regression Models using Stan with the brms package - Paul-Christian Bürkner (Uni Münster)
- RKWard: A Graphical User Interface and Integrated Development Environment for Statistical Analysis with R - Meik Michalke (Uni Düsseldorf)
For further details visit our KölnRUG Meetup site. Unfortunately, this event is already fully booked, but please sign up if you would like to come along to future events.
Notes from past meetings are available here.
Kölner R Users
,
KölnR
,
News
,
R
Bayesian Mixer on Meetup
We had our first successful Bayesian Mixer Meetup last Friday night at the Artillery Arms!
We expected about 15 - 20 people to turn up, when we booked the function room overlooking Bunhill Cemetery and Bayes' grave. Now, looking at the photos taken during the evening, it seems that our prior believe was pretty good.

The event started with a talk from my side about some very basic Bayesian models, which I used a while back to get my head around the concepts in an insurance context. My talk "Experience vs Data" was based on presentations I had given last year at LondonR and the Warsaw R user group.
Jon Sedar followed with a fascinating talk about outlier detection using PyMC3.
Suppose, you have a bunch of data points, most of them centred, but with some further away. How do you decide if they are outliers, or not?
This question sounds very relevant to me in the insurance context as well. I have heard stories of underwriters telling me that certain years or events (meaning costly losses) were freaks, and should be disregarded, or in other words, without those losses the underwriter would have made a huge profit. I am not sure, I buy those arguments, as they undermine the fundamental business proposition of insurance; to pay, when policyholders experience 'freak' events. I am getting on my soap box, which I shouldn't.
We had a good night, very good discussions and some drinks. As a result Jon and I are committed to organise another event.
Jon has already set up a Meetup page, so please register online and get in touch with ideas, venues, talks, etc.
We expected about 15 - 20 people to turn up, when we booked the function room overlooking Bunhill Cemetery and Bayes' grave. Now, looking at the photos taken during the evening, it seems that our prior believe was pretty good.

The event started with a talk from my side about some very basic Bayesian models, which I used a while back to get my head around the concepts in an insurance context. My talk "Experience vs Data" was based on presentations I had given last year at LondonR and the Warsaw R user group.
Jon Sedar followed with a fascinating talk about outlier detection using PyMC3.
Suppose, you have a bunch of data points, most of them centred, but with some further away. How do you decide if they are outliers, or not?
This question sounds very relevant to me in the insurance context as well. I have heard stories of underwriters telling me that certain years or events (meaning costly losses) were freaks, and should be disregarded, or in other words, without those losses the underwriter would have made a huge profit. I am not sure, I buy those arguments, as they undermine the fundamental business proposition of insurance; to pay, when policyholders experience 'freak' events. I am getting on my soap box, which I shouldn't.
We had a good night, very good discussions and some drinks. As a result Jon and I are committed to organise another event.
Jon has already set up a Meetup page, so please register online and get in touch with ideas, venues, talks, etc.
Slides/Files
Next Kölner R User Meeting: Friday, 4 December 2015
The 16th Cologne R user group meeting is scheduled for this Friday, 4 December 2015 and we have great line up with three talks followed by networking drinks.
- Monitoring process change using Bayesian methods (Mick Cooney)
A common business problem is to evaluate the effect of a change of process, and this talk will discuss a straightforward approach to this using conjugate priors.
- Editing R files with DataJoy (Dietmar Janetzko)
Brief introduction to the online collaborative data analysis platform DataJoy.
- Emoticons decoder for social media sentiment analysis in R (Jessica Peterka-Bonetta)
While R seems to be able to display some emoticons properly, many other times it doesn’t, making any further analysis impossible unless you get rid of them. With a little hack, I decoded these emoticons and put them all in a dictionary for further use.
Drinks and Networking
The event will be followed by drinks (Kölsch!) and networking opportunities.For further details visit our KölnRUG Meetup site. Please sign up if you would like to come along. Notes from past meetings are available here.
The organisers, Kirill Pomogajko and Markus Gesmann, gratefully acknowledge the sponsorship of Revolution Analytics, who support the Cologne R user group as part of their Matrix programme.
Kölner R Users
,
KölnR
,
News
,
R
Next Kölner R User Meeting: Friday, 18 September 2015
The 15th Cologne R user group meeting is scheduled for this Friday, 18 September 2015 and we have a full agenda with three talks followed by networking drinks.
- R in big data pipeline with luigi (Yuki Katoh)
R in big data pipeline: Put your awesome R codes into production. Learn how to build solid big data pipeline around it.
- shinyjs (Paul Viefers)
Using JavaScript in shiny, without knowing JavaScript
- Experience vs Data (Markus Gesmann)
How to asses risks with small data sets. Bayesian ideas, belief networks and a small simulation example in Stan/rstan.
Drinks and Networking
The event will be followed by drinks (Kölsch!) and networking opportunities.For further details visit our KölnRUG Meetup site. Please sign up if you would like to come along. Notes from past meetings are available here.
The organisers, Kirill Pomogajko and Markus Gesmann, gratefully acknowledge the sponsorship of Revolution Analytics, who support the Cologne R user group as part of their Matrix programme.
Kölner R Users
,
KölnR
,
News
,
R
Next Kölner R User Meeting: Friday, 26 June 2015
The next Cologne R user group meeting is scheduled for this Friday, 6 June 2015 and we have an exciting agenda with two talks followed by networking drinks.
- Data Science at the Commandline (Kirill Pomogajko)
- An Introduction to RStan and the Stan Modelling Language (Paul Viefers)
Drinks and Networking
The event will be followed by drinks (Kölsch!) and networking opportunities.For further details visit our KölnRUG Meetup site. Please sign up if you would like to come along. Notes from past meetings are available here.
The organisers, Bernd Weiß and Markus Gesmann, gratefully acknowledge the sponsorship of Revolution Analytics, who support the Cologne R user group as part of their Matrix programme.
Kölner R Users
,
KölnR
,
News
,
R
Interactive pivot tables with R
I love interactive pivot tables. That is the number one reason why I keep using spreadsheet software. The ability to look at data quickly in lots of different ways, without a single line of code helps me to get an understanding of the data really fast.
Perhaps I can do the same now in R as well. At yesterday's LondonR meeting Enzo Martoglio presented briefly his

The following animated Gif from Nicolas' project page gives an idea of the interactive functionality of PivotTable.js.
Perhaps I can do the same now in R as well. At yesterday's LondonR meeting Enzo Martoglio presented briefly his
rpivotTable package. Enzo builds on Nicolas Kruchten's PivotTable.js JavaScript library that provides drag'n'drop functionality and wraps it with htmlwidget into R. The result is an interactive pivot table rendered in either your default browser or the viewer pane of RStudio with one line of code: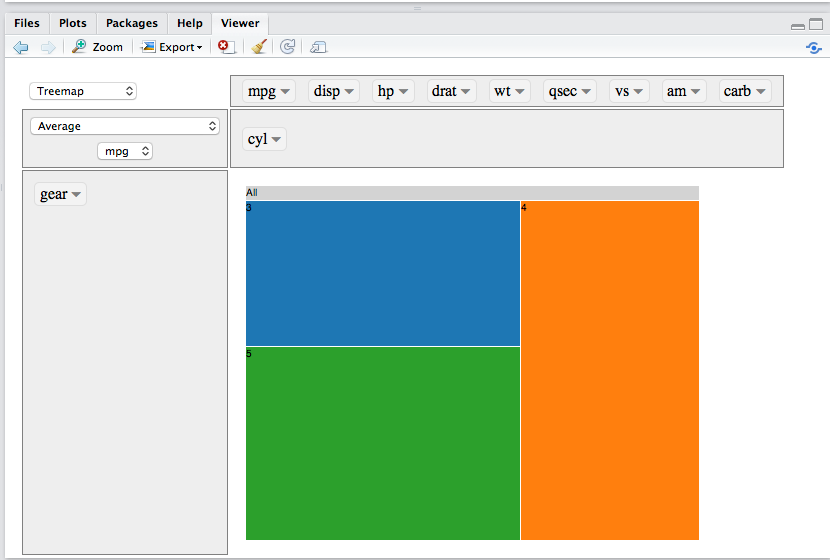
## Install packages
library(devtools)
install_github("ramnathv/htmlwidgets")
install_github("smartinsightsfromdata/rpivotTable")
## Load rpivotTable
library(rpivotTable)
data(mtcars)
## One line to create pivot table
rpivotTable(mtcars, rows="gear", col="cyl", aggregatorName="Average",
vals="mpg", rendererName="Treemap")
The following animated Gif from Nicolas' project page gives an idea of the interactive functionality of PivotTable.js.
 |
| Example of PivotTable.js Source: Nicolas Kruchten |
Session Info
R version 3.1.3 (2015-03-09)
Platform: x86_64-apple-darwin13.4.0 (64-bit)
Running under: OS X 10.10.2 (Yosemite)

locale:
[1] en_GB.UTF-8/en_GB.UTF-8/en_GB.UTF-8/C/en_GB.UTF-8/en_GB.UTF-8

attached base packages:
[1] stats     graphics  grDevices utils
[5] datasets  methods   base

other attached packages:
[1] rpivotTable_0.1.3.4

loaded via a namespace (and not attached):
[1] digest_0.6.8      htmltools_0.2.6
[3] htmlwidgets_0.3.2 RJSONIO_1.3-0
[5] tools_3.1.3       yaml_2.1.13
LondonR
,
News
,
PivotTable
,
R
Next Kölner R User Meeting: Friday, 6 March 2015
The next Cologne R user group meeting is scheduled for this Friday, 6 March 2015 and we have an exciting agenda with two talks, followed by networking drinks:
Using R in Excel via R.NET
Günter Faes and Matthias SpixMS Office and Excel are the 'de-facto' standards in many industries. Using R with Excel offers an opportunity to combine the statistical power of R with a familiar user interface. R.net offers a user friendly interfaces to Excel; R functions work just like Excel functions and are basically hidden away.
Text Mining with R
Cornelius PuschmannIn addition to the analysis of numerical data, R is increasingly attractive for processing text as well. Cornelius will give a very brief overview of common text mining techniques and their corresponding R implementations, with a focus on useful applications in the social sciences. Techniques will include corpus creation and management (package tm), latent semantic analysis (package lsa), and topic models (package topicmodels), as well as sentiment analysis (experimental package syuzhet). Simple but useful routines such as automatically inferring the language of a text (package text cat , or the gender of a first name (package genderize) will also be briefly pointed out.
Drinks and Networking
The event will be followed by drinks and schnitzel at the Lux.For further details visit our KölnRUG Meetup site. Please sign up if you would like to come along. Notes from past meetings are available here.
The organisers, Bernd Weiß and Markus Gesmann, gratefully acknowledge the sponsorship of Revolution Analytics, who support the Cologne R user group as part of their Matrix programme.
View Larger Map
R in Insurance 2015: Registration Opened
The registration for the third conference on R in Insurance on Monday 29 June 2015 at the University of Amsterdam has opened.

This one-day conference will focus again on applications in insurance and actuarial science that use R, the lingua franca for statistical computation.
The intended audience of the conference includes both academics and practitioners who are active or interested in the applications of R in insurance.
Invited talks will be given by:
We invite you to submit a one-page abstract for consideration. Both academic and practitioner proposals related to R are encouraged. The submission deadline for abstracts is 28 March 2015.
Please email your abstract of no more than 300 words (in text or pdf format) to r-in-insurance@uva.nl.
Details about the registration and abstract submission are given on the dedicated R in Insurance page at the University of Amsterdam.
For more information about the past events visit www.rininsurance.com.

This one-day conference will focus again on applications in insurance and actuarial science that use R, the lingua franca for statistical computation.
The intended audience of the conference includes both academics and practitioners who are active or interested in the applications of R in insurance.
Invited talks will be given by:
- Prof. Richard Gill, Leiden University
- Dr James Guszcza, FCAS, Chief Data Scientist, Deloitte - US
We invite you to submit a one-page abstract for consideration. Both academic and practitioner proposals related to R are encouraged. The submission deadline for abstracts is 28 March 2015.
Please email your abstract of no more than 300 words (in text or pdf format) to r-in-insurance@uva.nl.
Details about the registration and abstract submission are given on the dedicated R in Insurance page at the University of Amsterdam.
For more information about the past events visit www.rininsurance.com.
Conference
,
Insurance
,
News
,
R
,
R in Insurance
googleVis version 0.5.8 released
We released googleVis version 0.5.8 on CRAN last week. The update is a maintenance release for the forthcoming release of R 3.2.0.
New to googleVis? The package provides an interface between R and the Google Charts Tools, allowing you to create interactive web charts from R without uploading your data to Google. The charts are displayed by default via the R internal help browser.
Visit the examples of all googleVis charts on CRAN and review the vignettes.
|
| Screen shot of some of the Google Charts |
Visit the examples of all googleVis charts on CRAN and review the vignettes.
Next Kölner R User Meeting: Friday, 12 December 2014
The next Cologne R user group meeting is scheduled for this Friday, 12 December 2014.
We have an exciting agenda with two talks on Julia and Dynamic Linear Models:
Introduction to Julia for R Users
Hans Werner BorchersJulia is a high-performance dynamic programming language for scientific computing, with a syntax that is familiar to users of other technical computing environments (Matlab, Python, R, etc.). It provides a sophisticated compiler, high performance with numerical accuracy, and extensive mathematical function libraries.
Some of the highlights of Julia are an implementation of automated differentiation, an optimisation modelling language, also integrating some of the optimisation solvers available from the COIN-OR project, and user-contributed packages for time series, statistics and machine learning, or operations research.
Dynamic Linear Models and Kalman Filtering
Holger ZienOne of the problems most commonly presented to everybody working in statistics is forecasting time series. The textbook answer is to fit an ARMA model to the data and to use the model for prediction. This approach works well for long and stationary time series. However, often the actual time series one is given to analyse are more complicated. They are ridiculously short and clearly non-stationary. Dynamic Linear Models (DLM) and Kalman Filtering go one step beyond ARMA models and may be applied to these more complicated data. I will give a brief introduction into their mathematical background and will talk about my experience using them in practice.
Drinks and Networking
The event will be followed by drinks and schnitzel at the Lux.For further details visit our KölnRUG Meetup site. Please sign up if you would like to come along. Notes from past meetings are available here.
The organisers, Bernd Weiß and Markus Gesmann, gratefully acknowledge the sponsorship of Revolution Analytics, who support the Cologne R user group as part of their vector programme.
View Larger Map
googleVis 0.5.6 released on CRAN

gvisMotionChart. Its arguments xvar, yvar, sizevar and colorvar were not always picked up correctly. Thanks to Juuso Parkkinen for reporting this issue.
Example: Love, or to love
A few years ago Martin Hilpert posted an interesting case study for motion charts. Martin is a linguist and he researched how the usage of words in American English changed over time, e.g. some words were more often used as nouns in the past and then became more popular as a verb. Do you talk about love, or do you tell someone that you love her/him? Visit his motion chart web page for more information and details!R code
Session Info
R version 3.1.1 (2014-07-10)
Platform: x86_64-apple-darwin13.1.0 (64-bit)

locale:
[1] en_GB.UTF-8/en_GB.UTF-8/en_GB.UTF-8/C/en_GB.UTF-8/en_GB.UTF-8

attached base packages:
[1] stats     graphics  grDevices utils     datasets  methods
[7] base

other attached packages:
[1] googleVis_0.5.6

loaded via a namespace (and not attached):
[1] RJSONIO_1.3-0 tools_3.1.1
googleVis
,
Motion Chart
,
News
,
R
Next Kölner R User Meeting: Friday, 12 September 2014
The next Cologne R user group meeting is scheduled for this Friday, 12 September 2014.
We have a great agenda with international speakers:
- Maarten-Jan Kallen: Introduction to Renjin, the R interpreter for the JVM
- Jonathan Cornelissen, Martijn Theuwissen: DataCamp - An online interactive learning platform for R
Kölner R Users
,
KölnR
,
News
,
R
ChainLadder 0.1.8 released
Over the weekend we released version 0.1.8 of the ChainLadder package for claims reserving on CRAN.
As a result insurers don't know the upfront cost for their service, but rely on historical data analysis and judgement to predict a sustainable price for their offering. In General Insurance (or Non-Life Insurance, e.g. motor, property and casualty insurance) most policies run for a period of 12 months. However, the claims payment process can take years or even decades. Therefore often not even the delivery date of their product is known to insurers. The money set aside for those future claims payments are called reserves.

What is claims reserving?
The insurance industry, unlike other industries, does not sell products as such but promises. An insurance policy is a promise by the insurer to the policyholder to pay for future claims for an upfront received premium.As a result insurers don't know the upfront cost for their service, but rely on historical data analysis and judgement to predict a sustainable price for their offering. In General Insurance (or Non-Life Insurance, e.g. motor, property and casualty insurance) most policies run for a period of 12 months. However, the claims payment process can take years or even decades. Therefore often not even the delivery date of their product is known to insurers. The money set aside for those future claims payments are called reserves.

ChainLadder
,
Insurance
,
News
,
R
,
reserving
,
stochastic reserving
googleVis 0.5.5 released
Earlier this week we released googleVis 0.5.5 on CRAN. The package provides an interface between R and Google Charts, allowing you to create interactive web charts from R. This is mainly a maintenance release, updating documentation and minor issues.
New to googleVis? Review the examples of all googleVis charts on CRAN.
Perhaps the best known example of the Google Chart API is the motion chart, popularised by Hans Rosling in his 2006 TED talk.
|
| Screen shot of some of the Google Charts |
New to googleVis? Review the examples of all googleVis charts on CRAN.
Perhaps the best known example of the Google Chart API is the motion chart, popularised by Hans Rosling in his 2006 TED talk.
googleVis 0.5.3 released
Recently we released googleVis 0.5.3 on CRAN. The package provides an interface between R and Google Charts, allowing you to create interactive web charts from R.
Although this is mainly a maintenance release, I'd like to point out two changes:
|
| Screen shot of some of the Google Charts |
Although this is mainly a maintenance release, I'd like to point out two changes:
- Default chart width is set to 'automatic' instead of 500 pixels.
- Intervals for columns roles have to end with the suffix ".i", with "i" being an integer. Several interval columns are allowed, see the roles demo and vignette for more details.
- The order of y-variables in core charts wasn't maintained. Thanks to John Taveras for reporting this bug.
- Width and height of googleVis charts were only accepted in pixels, although the Google Charts API uses standard HTML units (for example, '100px', '80em', '60', 'automatic'). If no units are specified the number is assumed to be pixels. This has been fixed. Thanks to Paul Murrell for reporting this issue.
Next Kölner R User Meeting: Friday, 23 May 2014
The next Cologne R user group meeting is scheduled for this Friday, 23 May 2014.
To celebrate our 10th meeting we welcome:
Further details available on our KölnRUG Meetup site. Please sign up if you would like to come along. Notes from past meetings are available here.

The organisers, Bernd Weiß and Markus Gesmann, gratefully acknowledge the sponsorship of Revolution Analytics, who support the Cologne R user group as part of their vector programme.
View Larger Map
To celebrate our 10th meeting we welcome:
- Andrie de Vries (Revolution Analytics and Co-author of R for Dummies): Taking R to the Enterprise
- Markus Gesmann: googleVis overview and recent developments
Further details available on our KölnRUG Meetup site. Please sign up if you would like to come along. Notes from past meetings are available here.

The organisers, Bernd Weiß and Markus Gesmann, gratefully acknowledge the sponsorship of Revolution Analytics, who support the Cologne R user group as part of their vector programme.
View Larger Map
Kölner R Users
,
KölnR
,
News
,
R


