New R package to access World Bank data
Staying on top of new CRAN packages is quite a challenge nowadays. However, thanks to Dirk's CRANberries service I occasionally spot a new gem, such as
Similarly to the
With the functions of
Thus, to recreate the famous Gapminder chart by Hans Rosling, showing the correlation between fertility, i.e. number of children per woman, and life expectancy over time by country and region, I can write (note, a Flash player is required):
If you'd like to learn more about how to create interactive charts with googleVis, then check out the free tutorial on DataCamp.
wbstats, which appeared on CRAN last week. Similarly to the
WDI package, wbstats offers an interface to the World Bank database.With the functions of
wbstats the World Bank data can be searched and data for several indicators requested. Unlike WDI, the data is returned in a 'long' table with one column for all values and a separate column for the indicators. Additionally, the function wb allows me to specify how many most recent values (mrv) I am interested.Thus, to recreate the famous Gapminder chart by Hans Rosling, showing the correlation between fertility, i.e. number of children per woman, and life expectancy over time by country and region, I can write (note, a Flash player is required):
If you'd like to learn more about how to create interactive charts with googleVis, then check out the free tutorial on DataCamp.
Session Info
R version 3.2.4 (2016-03-10)
Platform: x86_64-apple-darwin13.4.0 (64-bit)
Running under: OS X 10.11.4 (El Capitan)

locale:
[1] en_GB.UTF-8/en_GB.UTF-8/en_GB.UTF-8/C/en_GB.UTF-8/en_GB.UTF-8

attached base packages:
[1] stats     graphics  grDevices utils     datasets
[6] methods   base

other attached packages:
[1] googleVis_0.5.10 data.table_1.9.6 wbstats_0.1

loaded via a namespace (and not attached):
[1] httr_1.1.0        R6_2.1.2          rsconnect_0.4.2.1
[4] tools_3.2.4       curl_0.9.7        RJSONIO_1.3-0
[7] jsonlite_0.9.19   chron_2.3-47
googleVis
,
R
,
wbstats
,
World Bank
Notes from 2nd Bayesian Mixer Meetup
Last Friday the 2nd Bayesian Mixer Meetup (@BayesianMixer) took place at Cass Business School, thanks to Pietro Millossovich and Andreas Tsanakas, who helped to organise the event.
 |
| Bayesian Mixer at Cass |
First up was Davide De March talking about the challenges in biochemistry experimentation, which are often characterised by complex and emerging relations among components.
The very little prior knowledge about complex molecules bindings left a fertile field for a probabilistic graphical model. In particular, Bayesian networks can help the investigator in the definition of a conditional dependence/independence structure where a joint multivariate probability distribution is determined. Hence, the use of Bayesian network can lead to a more efficient way of designing experiments.
 |
Davide De March: Bayesian Networks to design optimal experiments |
The second act of the night was Mick Cooney, presenting ideas of using growth curves to estimate the ultimate amounts paid in insurance by some cohort of policies.
The talk showed a model for these curves, discussed the implementation in Stan and how posterior predictive checks can be used to assess the output of the model.
 |
| Mick Cooney: Bayesian Modelling for Loss Curves in Insurance |
Thanks again to everyone who helped to make the event a success, particularly our speakers and Jon Sedar of Applied AI.
We are planning to run another event in mid-June. Please get in touch via our Meetup site with ideas and talk proposals.
R in Insurance: Abstract submission closes end of March

Hurry! The abstract submission deadline for the 4th R in Insurance conference in London, 11 July 2016 is approaching soon.
You have until the 28th of March to submit a one-page abstract for consideration. Both academic and practitioner proposals related to R are encouraged. Please email your abstract of no more than 300 words (in text or pdf format) to rinsuranceconference@gmail.com.
Invited talks will be given by:
- Mario V. Wüthrich, RiskLab, Department of Mathematics, ETH Zurich.
- Dan Murphy, President, Trinostics LLC.
Attendance of the whole conference is the equivalent of 6.5 hours of CPD for members of the Actuarial Profession.
For more information about the past events visit www.rininsurance.com.
Sponsors
The organisers gratefully acknowledge the sponsorship of Verisk/ISO, Mirai Solutions, RStudio, Applied AI, CYBAEA, and OASIS Loss Modelling Framework.Gold Sponsors
 |  |
Silver Sponsors
 |  |
 |  |
Notes from the Kölner R meeting, 26 February 2016
Last Friday the Cologne R user group came together for the 17th time. This time, we were in for a special treatment, with two talks by psychologists!
But, there was nothing to fear, we were in safe hands, and for the first time, we met at the new Microsoft office in Cologne.
First up was Meik Michalke from the University of Düsseldorf presenting the RKWard project. RKWard is a graphical user interface and integrated development environment for statistical analysis with R. RKWard is a fully featured and extendable environment for R, available on all platforms. Furthermore, as Meik demonstrated, it is very straightforward to build new plugins for RKWard. These plugins can extend the user interface, which is great if you build tools for people who are less familiar with R, but perhaps more with SPSS. Meik is one of the developers of RKWard and he uses it to run an analysis, develop packages and to teach statistics.
Next up was Paul-Christian Bürkner from the University of Münster, presenting an overview of his
Following the talks, there was still plenty of time for questions and networking. Microsoft provided us with a great venue and enough drinks to keep us going until finally our stomachs asked for food and, dare I say it, Kölsch. As a result some of us ended up in Rheinau, a nice gastropub around the corner.
Please get in touch, if you would like to present at the next meeting.
But, there was nothing to fear, we were in safe hands, and for the first time, we met at the new Microsoft office in Cologne.
 |
| Lecture room at Microsoft, Cologne |
First up was Meik Michalke from the University of Düsseldorf presenting the RKWard project. RKWard is a graphical user interface and integrated development environment for statistical analysis with R. RKWard is a fully featured and extendable environment for R, available on all platforms. Furthermore, as Meik demonstrated, it is very straightforward to build new plugins for RKWard. These plugins can extend the user interface, which is great if you build tools for people who are less familiar with R, but perhaps more with SPSS. Meik is one of the developers of RKWard and he uses it to run an analysis, develop packages and to teach statistics.
 |
| Download slides |
Next up was Paul-Christian Bürkner from the University of Münster, presenting an overview of his
brms package. The name is short for Bayesian regression models with Stan. Although the package is still less than one-year-old, it is already quite mature, allowing the user to specify regression models in the usual R formula syntax. brms takes those formula calls, writes out the Stan code, compiles and runs the model, and it also provides methods to plot and predict brms models. Hence, it is a great way to get started with Stan and to build more complex Bayesian models.  |
| Download slides |
Following the talks, there was still plenty of time for questions and networking. Microsoft provided us with a great venue and enough drinks to keep us going until finally our stomachs asked for food and, dare I say it, Kölsch. As a result some of us ended up in Rheinau, a nice gastropub around the corner.
Next Kölner R meeting
The next meeting will be scheduled in about three months time. Details will be published on our Meetup site. Thanks again to Microsoft for their support.Please get in touch, if you would like to present at the next meeting.
brms
,
Koelner R User
,
Kölner R Users
,
R
,
RKward
Next Kölner R User Meeting: Friday, 26 Feburary 2016

The 17th Cologne R user group meeting is scheduled for this Friday, 26 February 2016. We have two talks, followed by networking drinks.
- Introduction to Bayesian Regression Models using Stan with the brms package - Paul-Christian Bürkner (Uni Münster)
- RKWard: A Graphical User Interface and Integrated Development Environment for Statistical Analysis with R - Meik Michalke (Uni Düsseldorf)
For further details visit our KölnRUG Meetup site. Unfortunately, this event is already fully booked, but please sign up if you would like to come along to future events.
Notes from past meetings are available here.
Kölner R Users
,
KölnR
,
News
,
R
Bayesian Mixer on Meetup
We had our first successful Bayesian Mixer Meetup last Friday night at the Artillery Arms!
We expected about 15 - 20 people to turn up, when we booked the function room overlooking Bunhill Cemetery and Bayes' grave. Now, looking at the photos taken during the evening, it seems that our prior believe was pretty good.

The event started with a talk from my side about some very basic Bayesian models, which I used a while back to get my head around the concepts in an insurance context. My talk "Experience vs Data" was based on presentations I had given last year at LondonR and the Warsaw R user group.
Jon Sedar followed with a fascinating talk about outlier detection using PyMC3.
Suppose, you have a bunch of data points, most of them centred, but with some further away. How do you decide if they are outliers, or not?
This question sounds very relevant to me in the insurance context as well. I have heard stories of underwriters telling me that certain years or events (meaning costly losses) were freaks, and should be disregarded, or in other words, without those losses the underwriter would have made a huge profit. I am not sure, I buy those arguments, as they undermine the fundamental business proposition of insurance; to pay, when policyholders experience 'freak' events. I am getting on my soap box, which I shouldn't.
We had a good night, very good discussions and some drinks. As a result Jon and I are committed to organise another event.
Jon has already set up a Meetup page, so please register online and get in touch with ideas, venues, talks, etc.
We expected about 15 - 20 people to turn up, when we booked the function room overlooking Bunhill Cemetery and Bayes' grave. Now, looking at the photos taken during the evening, it seems that our prior believe was pretty good.

The event started with a talk from my side about some very basic Bayesian models, which I used a while back to get my head around the concepts in an insurance context. My talk "Experience vs Data" was based on presentations I had given last year at LondonR and the Warsaw R user group.
Jon Sedar followed with a fascinating talk about outlier detection using PyMC3.
Suppose, you have a bunch of data points, most of them centred, but with some further away. How do you decide if they are outliers, or not?
This question sounds very relevant to me in the insurance context as well. I have heard stories of underwriters telling me that certain years or events (meaning costly losses) were freaks, and should be disregarded, or in other words, without those losses the underwriter would have made a huge profit. I am not sure, I buy those arguments, as they undermine the fundamental business proposition of insurance; to pay, when policyholders experience 'freak' events. I am getting on my soap box, which I shouldn't.
We had a good night, very good discussions and some drinks. As a result Jon and I are committed to organise another event.
Jon has already set up a Meetup page, so please register online and get in touch with ideas, venues, talks, etc.
Slides/Files
Using SVG graphics in blog posts
My traditional work flow for embedding R graphics into a blog post has been via a PNG files that I upload online. However, when I created a 'simple' graphic with only basic curves and triangles for a recent post, I noticed that the PNG output didn't look as crisp as I expected it to be. So, eventually I used a SVG (scalable vector graphic) instead.
Creating a SVG file with R could't be easier; e.g. use the
To embed the figure into my page I could use either the traditional
With
There is a little trick required to display a graphic file hosted on GitHub.
By default, when I look for the raw URL, GitHub will provide an address starting with
Ok, let's look at the output. As a nice example plot I use a
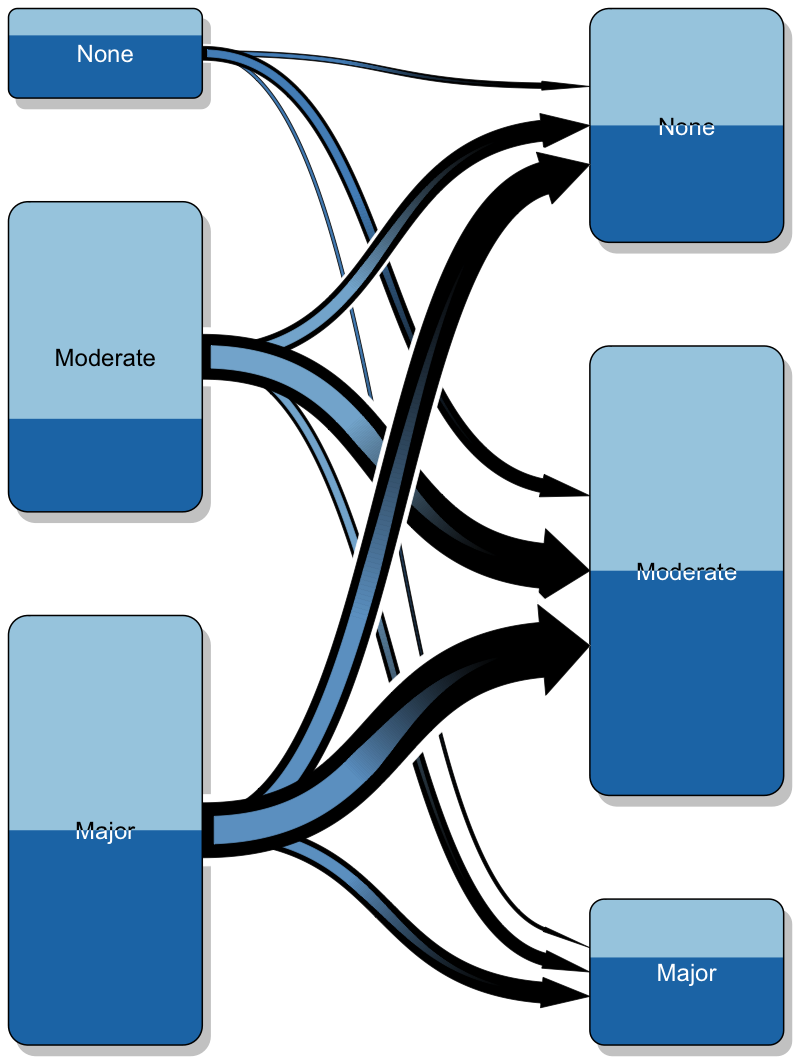
Yet, I don't think that SVG is always a good answer. The file size of an SVG file can grow quite quickly, if there are many points to be plotted. As an example check the difference in file size for two identical plots with 10,000 points.
Creating a SVG file with R could't be easier; e.g. use the
svg() function in the same way as png(). Next, make the file available online and embed it into your page. There are many ways to do this, in the example here I placed the file into a public GitHub repository.To embed the figure into my page I could use either the traditional
<img> tag, or perhaps better the <object> tag. Paul Murrell provides further details on his blog.With
<object> my code looks like this:<object data="https://rawgithub.com/mages/diesunddas/master/Blog/transitionPlot.svg" type="image/svg+xml" width="400"> </object>There is a little trick required to display a graphic file hosted on GitHub.
By default, when I look for the raw URL, GitHub will provide an address starting with
https://raw.githubusercontent.com/..., which needs to be replaced with https://rawgithub.com/....Ok, let's look at the output. As a nice example plot I use a
transitionPlot by Max Gordon, something I wanted to do for a long time.SVG output
PNG output
Conclusions
The SVG output is nice and crisp! Zoom in and the quality will not change. The PNG graphic on the other hand appears a little blurry on my screen and even the colours look washed out. Of course, the PNG output could be improved by fiddling with the parameters. But, after all it is a raster graphic.Yet, I don't think that SVG is always a good answer. The file size of an SVG file can grow quite quickly, if there are many points to be plotted. As an example check the difference in file size for two identical plots with 10,000 points.
x <- rnorm(10000)
png()
plot(x)
dev.off()
file.size("Rplot001.png")/1000
# [1] 118.071
svg()
plot(x)
dev.off()
file.size("Rplot001.svg")/1000
# [1] 3099.181
Update 10 Feb 2016
Or, is SVG the answer? Kenton pointed me towards the svglite package.library(svglite)
svglite(file = "Rplot001.svg")
plot(x)
dev.off()
file.size("Rplot001.svg")/1000
# [1] 973.619
gz <- function(in_path, out_path = tempfile()) {
out <- gzfile(out_path, "w")
writeLines(readLines(in_path), out)
close(out)
invisible(out_path)
}
file.size(gz("Rplot001.svg", "Rplot001.svgz")) / 1000
#> [1] 74.11R code
Session Info
R version 3.2.3 (2015-12-10)
Platform: x86_64-apple-darwin13.4.0 (64-bit)
Running under: OS X 10.11.3 (El Capitan)

locale:
[1] en_GB.UTF-8/en_GB.UTF-8/en_GB.UTF-8/C/en_GB.UTF-8/en_GB.UTF-8

attached base packages:
[1] grid      stats     graphics  grDevices utils     datasets
[7] methods   base

other attached packages:
[1] RColorBrewer_1.1-2 Gmisc_1.3          htmlTable_1.5
[4] Rcpp_0.12.3

loaded via a namespace (and not attached):
 [1] Formula_1.2-1       knitr_1.12.3
 [3] cluster_2.0.3       magrittr_1.5
 [5] splines_3.2.3       munsell_0.4.2
 [7] colorspace_1.2-6    lattice_0.20-33
 [9] stringr_1.0.0       plyr_1.8.3
[11] tools_3.2.3         nnet_7.3-12
[13] gtable_0.1.2        latticeExtra_0.6-26
[15] htmltools_0.3       digest_0.6.9
[17] forestplot_1.4      survival_2.38-3
[19] abind_1.4-3         gridExtra_2.0.0
[21] ggplot2_2.0.0       acepack_1.3-3.3
[23] rsconnect_0.3.79    rpart_4.1-10
[25] rmarkdown_0.9.2     stringi_1.0-1
[27] scales_0.3.0        Hmisc_3.17-1
[29] XML_3.98-1.3        foreign_0.8-66


